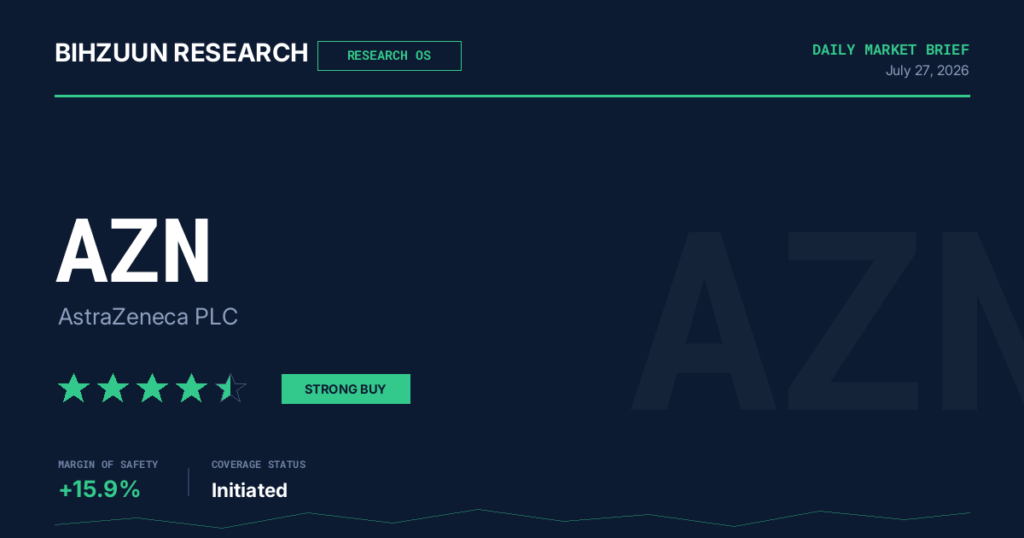
Bihzuun Research — Institutional Equity Report
AstraZeneca PLC | Ticker: AZN | Report Date: July 27, 2026
| Ticker | BRS Rating | 12-Month Price Target | Current Price | Margin of Safety | Timeframe | BRR Posture |
|---|---|---|---|---|---|---|
| AZN |
★ ★ ★ ★ ★ Strong Buy |
$194 – $196 | $169.26 | ~15% | 12 – 24 Months | Constructive / Accumulate on Weakness |
1. Executive Summary
AstraZeneca (AZN) enters the second half of 2026 with its investment thesis materially intact yet operationally bifurcated: a world-class oncology and rare disease engine that continues to compound at double-digit rates, set against a China commercial franchise under structural pricing pressure that is eroding near-term earnings quality faster than consensus models anticipated. This morning’s Q2 2026 print — core EPS of $2.63 versus consensus of $2.48, an 18% constant-currency beat — validates the growth engine while simultaneously crystallising the China overhang. The maintained full-year guidance for low double-digit core EPS growth reinforces management credibility under Pascal Soriot, and the pipeline density remains among the richest in global biopharma. On a composite multi-model valuation, AZN trades at a roughly 15% discount to intrinsic fair value with a 12-month base-case price target of $194–$196. A binary regulatory event — the FDA decision on camizestrant (Etcamah) expected in late August 2026 — represents the single most asymmetric near-term catalyst. The Bihzuun Research Score of 4.5 stars / Strong Buy reflects a high-quality growth compounder available at a fair-to-discounted entry point for investors with appropriate conviction and a medium-term horizon.
2. Business Overview & Economic Moat
Corporate Profile
AstraZeneca is a global biopharmaceutical company headquartered in Cambridge, United Kingdom, with principal research operations across Cambridge, Gothenburg, Gaithersburg, and — critically — Shanghai and Wuxi. The company operates across three therapeutic area segments: Oncology (approximately 44% of revenues), Cardiovascular, Renal & Metabolism (CVRM), and Rare Disease / BioPharmaceuticals. With $58.7 billion in reported revenues, AZN ranks among the top five pharmaceutical companies globally by revenue, a position achieved under CEO Pascal Soriot through one of the most remarkable corporate strategic transformations in modern pharmaceutical history.
Moat Assessment — Width: Wide | Durability: High with Known Tail Risk
Bihzuun Research assesses AstraZeneca’s competitive moat as Wide, underpinned by three structurally reinforcing pillars:
- Oncology Franchise Depth. AstraZeneca is one of only three companies — alongside Merck and Bristol-Myers Squibb — commanding meaningful global oncology pharmaceutical market share, with the combined trio accounting for roughly 35% of global oncology revenues. AZN’s oncology portfolio spans multiple modalities and tumour types: Tagrisso (NSCLC, EGFR-mutated), Lynparza (BRCA-mutated cancers), Imfinzi (immuno-oncology), Calquence (haematology), and the strategically pivotal Enhertu in partnership with Daiichi Sankyo. Oncology revenues rose 14% at constant exchange rates in 2025, and Q2 2026 cancer drug sales were up a further 15%, confirming durable momentum rather than one-period outperformance.
- ADC Platform Leadership via Daiichi Sankyo Partnership. The antibody-drug conjugate (ADC) collaboration with Daiichi Sankyo represents a genuinely differentiated structural asset that competitors are struggling to replicate at equivalent clinical quality and speed. Enhertu — approved across HER2+ metastatic breast cancer, HER2-low MBC, HER2-mutated NSCLC, and gastric cancer — has set commercial and clinical benchmarks for the ADC modality. Datroway, a second ADC from the partnership, received FDA approval for HR+/HER2- breast cancer and is advancing in NSCLC. Patent protections on Enhertu extend past 2030, providing a durable revenue runway on one of oncology’s highest-growth platforms. Pfizer’s acquisition of Seagen has narrowed AZN’s first-mover ADC advantage but has not erased it.
- Geographic Commercial Infrastructure. AstraZeneca’s deep Chinese operational footprint — integrated R&D, regulatory expertise, and commercial infrastructure in Shanghai and Wuxi — has historically provided access to the world’s most rapidly growing pharmaceutical market. While this is an increasingly double-edged competitive asset given current volume-based procurement (VBP) headwinds (addressed in the Risk section), it remains a strategic long-term differentiator that most Western peers cannot replicate on a five-year horizon without substantial capital commitment.
The moat’s primary tail risk is temporal: the patent expiry schedule post-2032 for Tagrisso, Imfinzi, and Calquence creates a known revenue overhang that pipeline execution must offset. This is a known and priceable risk, not an unknown structural threat — an important distinction that supports the BRS rating.
3. Financial Deep Dive
Income Statement Quality
| Metric | Value | Bihzuun Assessment |
|---|---|---|
| Revenue | $58.7 billion | Top-tier scale; consistent double-digit growth trajectory |
| Net Income | $10.3 billion | Solid absolute; reflects ongoing R&D and BD reinvestment |
| Net Margin | ~17.5% | Respectable; not exceptional — growth reinvestment depresses margin vs. peers |
| Return on Equity | 21.1% | Strong; driven by genuine business quality, not financial engineering |
| EPS | $13.20 | Anchors valuation work; Q2 2026 core EPS run-rate confirms progression |
| Dividend Yield | 1.89% | Modest; appropriate for a growth-reinvestment story |
| Payout Ratio | 24.2% | Conservative; preserves capital for pipeline and debt management |
| Growth Scorecard Sub-Score | 99 / 100 | Exceptional; top-decile across coverage universe |
The Growth scorecard sub-score of 99/100 is the standout financial data point in this report and demands contextualisation. It reflects sustained revenue and earnings momentum consistent with AZN’s oncology and rare disease pipeline execution — not a one-quarter anomaly. This morning’s Q2 2026 core EPS beat of 18% constant-currency growth corroborates the structural nature of the growth signal. The 17.5% net margin, while not exceptional in an absolute sector sense, should be understood in the context of AZN’s aggressive reinvestment posture: the company is simultaneously funding a late-stage clinical pipeline of over 20 high-value readouts in the next 18 months, sustaining its ADC partnership economics, and building out the elecoglipron obesity Phase III programme. Margin compression relative to theoretical maximums is the deliberate cost of compounding.
Balance Sheet & Leverage
| Metric | Value | Bihzuun Assessment |
|---|---|---|
| Equity Base | $48.7 billion | Substantial; supports ROE quality conclusion |
| Long-Term Debt | $24.7 billion | Manageable but not conservative |
| Net Debt (Q1 2026) | $25.9 billion | Monitoring required; limits transformative M&A flexibility |
| Long-Term Debt Ratio | 33.7% | Middling; serviceable at current cash generation rates |
| Net Debt / EBITDA (LTM) | ~1.3x | Acceptable; rises materially if revenue decelerates |
| Balance Sheet Sub-Score | 58 / 100 | Below mid-range; the principal valuation moderating factor |
The Balance Sheet scorecard score of 58/100 is the most important moderating signal in AZN’s financial profile and deserves candid institutional treatment. The 33.7% long-term debt ratio is not alarming in isolation — many investment-grade pharmaceutical companies carry comparable or higher leverage — but it becomes consequential when stress-tested against AZN’s known risk factors. A meaningful revenue deceleration from China VBP erosion, or a pipeline setback in a flagship oncology programme, would simultaneously compress operating cash flow and widen credit spreads, squeezing the leverage ratio from both directions. At 1.3x Net Debt/EBITDA the company has adequate headroom today, but it does constrain the capacity for a transformative acquisition at a moment when the obesity/metabolic pipeline gap (discussed below) could theoretically benefit from a bolt-on. The conservative 24.2% payout ratio is the correct capital allocation posture given this profile and should be maintained.
Composite Scorecard Summary
| Scorecard Dimension | Score | Signal |
|---|---|---|
| Growth | 99 / 100 | Exceptional — dominant bull case driver |
| Balance Sheet | 58 / 100 | Middling — key monitoring variable |
| Valuation | 50 / 100 | Fair value; not a bargain, not expensive |
| Income | 47 / 100 | Below average — this is not a yield investment |
| Composite | 69.5 / 100 | High-quality growth compounder at fair-to-discounted pricing |
4. Multi-Model Valuation Assessment
Model Output Summary
| Valuation Model | Output | Weight / Interpretation |
|---|---|---|
| DCF — Declining Growth | $196.17 | High weight; most conservative DCF variant; aligns with base case |
| Comparable Companies | $194.61 | High weight; market-informed; tight convergence with DCF |
| Earnings Power Value (EPV) | $165.00 | High weight; zero-growth intrinsic floor — current price just above this |
| Graham Number | $136.40 | Moderate weight; most conservative anchor; asset-earnings basis |
| Gordon Growth DDM | $2,052 | Excluded from composite — terminal growth assumption sensitivity outlier |
| Composite Median (ex-DDM) | $194.61 | Primary reference; ~15% premium to current price |
Valuation Narrative
The multi-model valuation mosaic converges on a notably coherent picture once the Gordon Growth DDM outlier is appropriately excluded. The tight clustering of the DCF Declining output ($196.17) and the Comparable Companies output ($194.61) around the same price level provides meaningful cross-methodology validation — these two models approach intrinsic value from fundamentally different analytical directions (cash flow projection versus market-implied multiples) and arrive at near-identical conclusions, which Bihzuun Research treats as a signal of robust valuation support rather than coincidence.
The Earnings Power Value of $165.00 carries particular interpretive weight. EPV represents the intrinsic value of the business assuming zero future growth — essentially the liquidation value of current earnings capacity. With AZN’s current price of $169.26 sitting just $4.26 above the EPV floor, investors at current prices are paying only a minimal growth premium above zero-growth intrinsic value. For a business with a Growth scorecard sub-score of 99/100 and a confirmed pipeline of over 20 high-value readouts in the next 18 months, this represents an unusually favourable entry dynamic. The market is implicitly pricing in almost no growth beyond current earnings power — a disconnect that the bull case resolves over the next 12–24 months as pipeline catalysts materialise.
The Graham Number of $136.40 is the appropriate downside scenario anchor. It reflects an unencumbered asset-earnings based valuation and highlights that the stock is not cheap on a pure balance-sheet basis. However, applying Benjamin Graham’s asset-centric framework to a knowledge-intensive pharmaceutical compounder with $58.7 billion in revenues and a world-class ADC platform understates the quality of the intangible asset base. Bihzuun Research treats the Graham Number as a stress-test floor, not a fair value estimate.
12-Month Sensitivity Range
| Scenario | Price Target | Key Assumptions |
|---|---|---|
| Bear Case | $185 | Camizestrant FDA rejection; China erosion accelerates; guidance cut |
| Base Case | $194 – $196 | Guidance maintained; camizestrant EU launch; pipeline execution on track |
| Bull Case | $207 | Camizestrant US approval; China stabilisation; elecoglipron Phase III initiation beats |
The bear case scenario of $185 warrants emphasis: even in the downside scenario, AZN trades above current levels. This asymmetry — limited downside from current prices even under adverse assumptions — is a defining feature of the risk/reward profile that supports the Strong Buy BRS rating. The current price of $169.26 sits below the bear case, meaning the market is currently pricing outcomes worse than Bihzuun Research’s bear case. This mispricing is the margin of safety.
5. Competitive & Industry Analysis
Oncology — The Primary Competitive Arena
The global oncology pharmaceutical market remains the most strategically contested space in biopharma. AstraZeneca, Merck, and Bristol-Myers Squibb collectively hold approximately 35% of global oncology revenues, with competitive intensity highest in the PD-1/PD-L1 checkpoint inhibitor segment and the rapidly evolving ADC modality. Merck’s Keytruda retains leading global PD-1/PD-L1 market share today, but its own 2028 patent cliff creates a structural market share redistribution opportunity that favours AstraZeneca’s Imfinzi in the medium term — a dynamic that is underappreciated by consensus. Roche’s established ADC experience and biologics platform provide credible competition in breast cancer and haematology, but AZN/Daiichi Sankyo’s clinical execution with Enhertu and Datroway has consistently outpaced Roche’s ADC timeline in approvals and label expansions.
The most significant emerging competitive threat in oncology is structural and geographic: China has become the world’s most prolific ADC patent-filing jurisdiction, with Jiangsu Hengrui (31 pipeline ADCs, one approved in 2025), RemeGen, and Innovent Biologics all advancing ADC programmes at scale. The long-term pricing and market-share implications of Chinese ADC commercialisation — both domestically and potentially in export markets — represent a risk that AZN management has not yet fully quantified for investors and that warrants ongoing monitoring in analyst models.
CVRM — Under Structural Pressure
The Cardiovascular, Renal & Metabolism segment faces genuine structural headwinds. Brilinta declined 67% at constant exchange rates in Q2 2025 following generic entry in the US and Europe — a stark illustration of how rapidly loss-of-exclusivity (LOE) erosion materialises. Farxiga faces US generic competition following multiple generic launches in Q2 2026, and China VBP implementation is compressing Farxiga volumes in AZN’s second-largest market. Eli Lilly and Boehringer Ingelheim’s Jardiance remains a formidable SGLT2 competitor. These are not temporary headwinds — they are structural features of the CVRM landscape that will require offsetting growth from newer assets.
Obesity / Metabolic — The Strategic Frontier
The GLP-1 and obesity therapeutic revolution led by Novo Nordisk and Eli Lilly is the most significant structural event reshaping cardiometabolic pharmaceutical markets in a decade. AstraZeneca has responded with genuine clinical ambition: elecoglipron, an oral GLP-1 receptor agonist, is advancing into an extensive Phase III programme following positive Phase IIb data from the VISTA and SOLSTICE trials. VISTA achieved 11.8% weight loss at 36 weeks; SOLSTICE demonstrated 1.9% HbA1c reduction at 26 weeks in the type 2 diabetes cohort. Published in The Lancet, these results are clinically meaningful, though the commercial gap to Wegovy and Mounjaro remains substantial. Elecoglipron’s oral formulation is a genuine differentiator in the convenience dimension, and Phase III initiation milestones will be a key catalyst watch item through 2026–2027. AZN is a late but credible entrant in the most important pharmaceutical growth market of the decade.
6. Risk Mapping
| Risk Category | Specific Risk | Severity | Immediacy | Mitigation |
|---|---|---|---|---|
| Regulatory | Camizestrant FDA rejection (AdCom voted 3-6 against benefit-risk) | High | Imminent (late August 2026) | CHMP positive opinion provides European approval backstop; partial price-in post-AdCom |
| Geographic / Commercial | China CVRM revenue erosion via VBP; 13% China revenue decline in Q2 2026 | High | Current / Ongoing | Oncology segment partially insulated; management maintains guidance |
| Patent / LOE | Tagrisso, Imfinzi, Calquence exclusivity loss from 2032; Tagrisso earliest generic July 2032 | High | Medium-Term (post-2030) | Pipeline density; ADC platform; elecoglipron obesity programme |
| Competitive | Chinese ADC entrants (Hengrui, RemeGen, Innovent) in domestic and global markets | Medium-High | Emerging (2026–2028) | Enhertu patent protections; first-mover brand positioning in HER2-low |
| LOE / Generic | Brilinta -67% at CER post-generic; Farxiga US generic launches Q2 2026 | Medium | Current | Oncology growth offsets; SGLT2 franchise continues ex-US |
| Balance Sheet | Net debt $25.9B; 1.3x EBITDA leverage constrains M&A optionality | Medium | Ongoing | Conservative payout ratio (24.2%); FCF generation supports deleveraging |
| Pipeline / Clinical | Late-stage oncology trial failures; execution against 2030 $80B revenue target | High | Ongoing (20+ readouts next 18 months) | Portfolio diversification; multiple independent programmes |
| FX / Macro | Dollar strength on hawkish FOMC compresses CER-reported revenues and multiple | Medium | Near-Term (FOMC July 29) | Geographic revenue diversification; CER guidance framework |
| Legal / Regulatory | US government investigations; antitrust litigation; ongoing legal proceedings | Medium | Ongoing | Disclosure; legal reserves; precedent from peer outcomes |
Cross-referencing the risk map with the valuation analysis: the bear case scenario of $185 incorporates the two most severe near-term risks simultaneously (camizestrant rejection and China acceleration). The fact that the bear case still represents upside from today’s price quantifies the margin of safety embedded at the $169.26 entry point. However, investors should note that a combination of multiple risk materialisations — camizestrant rejection concurrent with a pipeline setback and an FOMC hike — could theoretically push the stock below the EPV floor of $165.00 on a sentiment basis, even if intrinsic value analysis does not support sustained trading below that level.
7. Catalyst Monitor
⚑ IMMINENT BINARY EVENT — Camizestrant (Etcamah) FDA Decision: Late August 2026
This is the single highest-priority event in AZN’s near-term investment timeline. The FDA has extended the PDUFA date to review additional data supporting the NDA for camizestrant in combination with a CDK4/6 inhibitor for first-line HR+/HER2- advanced breast cancer with emergent ESR1 mutation. The regulatory path is contested: the FDA’s Oncologic Drugs Advisory Committee voted 3-6 against the benefit-risk profile, with the central concern being that approving camizestrant would endorse a treatment paradigm change at ESR1 mutation detection without established evidence that this approach improves long-term patient outcomes versus waiting for radiographic progression. Critically, the European CHMP has already issued a positive opinion, and the drug will be marketed as Etcamah in Europe — providing an approval backstop that limits the commercial downside of a US rejection. Bihzuun Research assesses this event as the primary near-term asymmetric catalyst: FDA approval would be a meaningful upside driver and validate the 2030 revenue target assumptions; rejection would pressure the stock but is partially priced in following the AdCom result and the European approval buffer.
Upcoming Catalyst Schedule
| Date | Event | AZN Impact | Direction |
|---|---|---|---|
| Today — July 27, 2026 | Q2 2026 Results Print | Core EPS $2.63 vs. $2.48 consensus; guidance maintained; China -13% | Net Positive — tempered by China |
| July 29, 2026 | FOMC Rate Decision | Hawkish surprise = USD strength → CER revenue compression + multiple pressure | Macro headwind risk |
| July 30, 2026 | Q2 US GDP Advance Estimate | Shapes September FOMC expectations; indirect effect on healthcare multiples | Macro context |
| August 7, 2026 | US Payrolls Report | September FOMC hike/hold swing variable; defensive rotation implications | Macro context |
| Late August 2026 | Camizestrant FDA PDUFA Decision | Binary / High-stakes; 3-6 AdCom against; CHMP positive backstop | Asymmetric upside if approved |
| Q3–Q4 2026 | Elecoglipron Phase III Enrollment Milestones | Validates obesity pipeline credibility; sentiment driver for 2030 target | Positive if on schedule |
| Q3–Q4 2026 | Multiple Oncology Pipeline Readouts (20+ over 18 months) | Collective confirmation of pipeline density; individual results binary | Portfolio diversification limits single-event risk |
| Q4 2026 | China Revenue Trajectory Q3 Update | Confirmation or deterioration of -13% Q2 China trend; critical monitoring point | Pivotal for 2027 consensus re-rating |
8. Investment Verdict
Synthesis
AstraZeneca’s investment thesis in July 2026 rests on a durable structural foundation: the world’s deepest oncology pipeline outside of Merck, ADC platform leadership co-anchored by the Daiichi Sankyo partnership, a Growth scorecard at the 99th percentile of Bihzuun’s coverage universe, and a multi-model intrinsic valuation that places the current price at approximately 15% below composite fair value and barely above the zero-growth EPV floor. These are the quantitative and qualitative conditions in which high-conviction accumulation is typically rewarded over a 12–24 month horizon.
Against this backdrop, three risks command institutional discipline. First, the camizestrant FDA decision in late August is a genuine binary with contested regulatory optics — the 3-6 AdCom vote against is not a trivial signal, and investors adding exposure today should size positions with this event in mind. Second, China