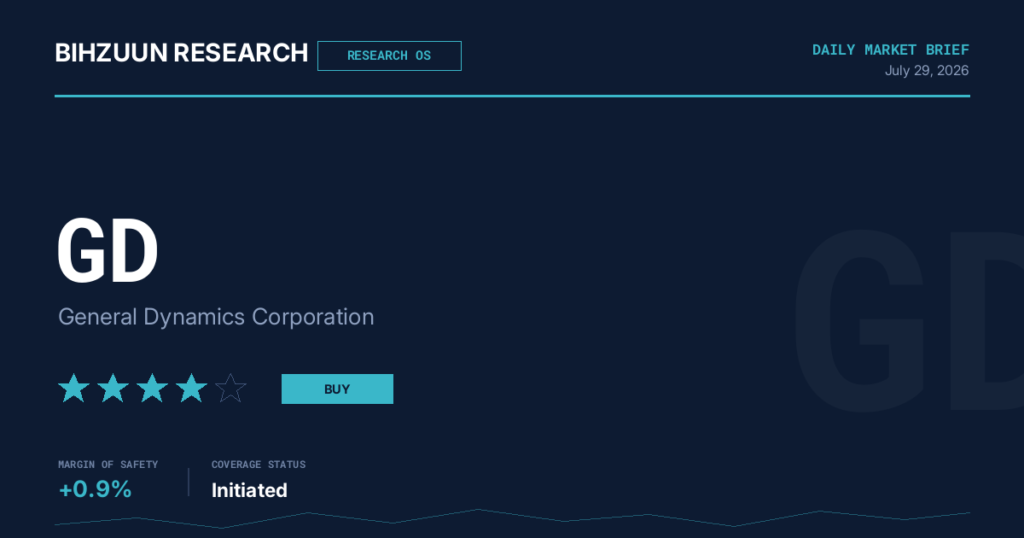
GD General Dynamics Corporation
1. Research Summary Snapshot
The table below provides the top-line investment parameters. All fundamental data, valuation targets, and risk assessments are elaborated in the sections that follow.
| Parameter | Detail |
|---|---|
| Ticker / Exchange | GD / NYSE |
| Company | General Dynamics Corporation |
| Sector / Industry | Industrials — Aerospace & Defense |
| Current Price | $393.19 |
| Bihzuun Research Score (BRS) |
★ ★ ★ ★ ★ Buy |
| 12–18 Month Price Target | $200 (fundamental earnings-power basis) | See valuation narrative for regime context |
| Composite Intrinsic Value Median | $183.02 |
| Margin of Safety (vs. current price) | −53.5% (stock trades at ~2.1× composite intrinsic value) |
| DCF Model Range | $373.63 (bear) – $420.68 (bull) | Central: $396.67 |
| Target Timeframe | 12–18 months |
| Dividend Yield / Payout Ratio | 1.57% / 39.5% |
| Revenue / Net Income | $52.55B / $4.21B (8.0% net margin) |
| EPS | $15.64 |
| BRS Composite Score | 49.9 / 100 — Financial Quality: 66 | Balance Sheet: 73 | Growth: 65 | Valuation: 0 | Income: 39 |
| Bihzuun Research Rating (BRR) Posture | Constructive / Selective Buy — Hold Existing; Avoid Aggressive Adds Pre-Earnings |
| Primary Near-Term Risk | Valuation compression; Marine Systems execution; DOGE / GDIT headline risk |
| Primary Near-Term Catalyst | Q2 2026 earnings beat + 2026 revenue guidance raise (today, BMO) |
2. Business Overview & Economic Moat
Understanding the structural architecture of GD’s competitive position is essential context for interpreting both the valuation premium and the risk profile that follows.
Corporate Architecture
General Dynamics Corporation is one of the largest defense and aerospace enterprises in the world, operating across four principal business segments: Aerospace (Gulfstream business jets), Marine Systems (nuclear submarines and surface combatants), Combat Systems (armored vehicles and ordnance), and Technologies (IT and mission-critical communications via GDIT). This diversified structure affords GD revenue stability that single-segment peers cannot match, with the commercial Gulfstream franchise providing a valuable earnings counterweight to government-dependent segments in periods of fiscal uncertainty.
Economic Moat Assessment Wide & Durable
Bihzuun Research assesses GD’s economic moat as wide and durable, resting on four mutually reinforcing structural pillars:
- Physical Infrastructure Monopoly (Marine Systems): Electric Boat is one of only two U.S. yards capable of constructing nuclear-powered submarines — the other being HII’s Newport News facility. The capital intensity, regulatory complexity, and decades-long workforce specialization required to replicate this capability represent a barrier of entry that is effectively insurmountable on any commercially relevant timeline. This structural duopoly ensures GD’s participation in every U.S. submarine program for the foreseeable future.
- Long-Cycle Contract Visibility: GD’s disclosed total backlog exceeded $95 billion at the latest reporting date, encompassing classified and unclassified Technologies backlog, multi-year Marine Systems construction contracts, and a deep Gulfstream order book. This creates revenue visibility that renders the earnings stream far more bond-like in its predictability than typical industrial companies — a key justification for the DCF model’s ability to support current pricing (discussed in Section 4).
- Regulatory and Certification Barriers (Gulfstream Aerospace): The ultra-long-range business jet market is among the most concentrated commercial aviation sub-segments, with Gulfstream holding dominant share in the large-cabin category. FAA certification timelines, type-rating requirements, and the brand equity embedded in the Gulfstream franchise create meaningful barriers for new entrants and constrain competitive displacement from Bombardier and Dassault. Gulfstream delivered a Q1 2026 record of 38 aircraft, generating $3.28 billion in segment revenue with operating margin expanding to 15.0% — confirming the franchise’s operational quality.
- Switching Costs and Program Lock-In (Combat & Technologies): Once selected as the prime contractor on a major platform — whether the Abrams tank upgrade cycle or a major GDIT IT infrastructure contract — the costs and risks of transitioning to a competitor are prohibitive for the U.S. government customer. This creates durable, high-retention revenue streams that compound GD’s backlog stability.
Segment Revenue Mix & Strategic Balance
| Segment | Key Products / Activities | Moat Characteristic | Near-Term Outlook |
|---|---|---|---|
| Aerospace (Gulfstream) | G700, G800 ultra-long-range jets; MRO services | Brand, certification barriers, switching costs | Positive; margin expansion, record deliveries |
| Marine Systems (Electric Boat) | Virginia-class, Columbia-class submarines; DDG | Physical infrastructure duopoly | Positive demand; execution risk on throughput |
| Combat Systems | Abrams MBT, Stryker, ammunition | Program lock-in, sole-source positions | Stable; supplemental funding watch |
| Technologies (GDIT) | IT services, C4ISR, mission support | Long-term government IT contracts | Cautious; DOGE headwind risk, softer growth |
3. Financial Deep Dive
GD’s financial profile reflects the hallmarks of a mature, disciplined capital allocator operating in a high-barrier industry. The headline metrics are robust; the critical tension resides in valuation, not fundamental quality.
Income Statement & Profitability
| Metric | Value | Bihzuun Assessment |
|---|---|---|
| Revenue | $52.55 billion | Scale confers procurement leverage and program diversification |
| Net Income | $4.21 billion | Solid absolute profit pool; supported by long-term contract structures |
| Net Margin | 8.0% | Respectable for a mixed government/commercial portfolio; Gulfstream margin expansion is a positive lever |
| EPS | $15.64 | Anchors per-share valuation; DCF requires sustained EPS growth to justify current multiples |
| Return on Equity | 16.4% | Healthy; reflects disciplined capital deployment without excessive leverage |
Balance Sheet & Capital Structure
| Metric | Value | Bihzuun Assessment |
|---|---|---|
| Shareholders’ Equity | $25.62 billion | Substantial book value base; limits downside in stress scenarios |
| Long-Term Debt | $7.007 billion | Conservative absolute level for a company of this scale |
| LT Debt / Equity Ratio | 21.5% | Conservative for defense sector; strong debt serviceability at current earnings levels |
| Balance Sheet BRS Sub-Score | 73 / 100 | One of the strongest sub-scores in the composite; key risk buffer |
Dividend & Capital Return Framework
GD’s dividend yield of 1.57% with a payout ratio of 39.5% represents a deliberately sustainable posture — the company retains more than 60 cents of every dollar earned, providing dry powder for share repurchases, R&D investment, and M&A optionality. This is not a yield story, but it is evidence of management’s disciplined capital allocation philosophy. The low income sub-score of 39 reflects the modest absolute yield rather than any structural weakness in dividend coverage; the dividend is well-covered and at no near-term risk.
BRS Scorecard Composite
| BRS Sub-Dimension | Score (/ 100) | Interpretation |
|---|---|---|
| Financial Quality | 66 | Solid margins, ROE, and earnings consistency |
| Balance Sheet Strength | 73 | Conservative leverage; strong debt service capacity |
| Growth | 65 | Sustained growth supported by backlog and Gulfstream ramp |
| Valuation | 0 | Current price materially exceeds fundamental model outputs — the single most significant risk flag in this report |
| Income | 39 | Modest yield; sustainable payout; not a yield-oriented investment |
| Composite BRS Score | 49.9 / 100 | Mid-range composite; quality is excellent, valuation is the critical drag |
4. Multi-Model Valuation Assessment
Bihzuun Research applies a multi-model valuation discipline, cross-referencing earnings-power, asset-value, and discounted cash flow frameworks to construct a range of outcomes rather than relying on any single methodology. The spread of results for GD is unusually wide and demands direct institutional engagement.
Valuation Model Output Summary
| Model | Implied Value | Methodology Basis | Weight in Assessment |
|---|---|---|---|
| Graham Number | $183.02 | EPS × Book Value; earnings and asset floor | Significant — anchors lower bound |
| Earnings Power Value (EPV) | $195.50 | Normalized after-tax earnings capitalized at cost of capital | Significant — confirms earnings floor |
| Gordon Growth DDM | $147.29 | Dividend discount; perpetuity growth on current payout | Moderate — reflects income stream only |
| Comparable Analysis | $130.68 | Peer median multiples applied to GD earnings | Moderate — sector multiple signal |
| DCF Declining Growth Model | $396.67 | Long-duration free cash flow; terminal value capture | High for market regime; high sensitivity to assumptions |
| Composite Median | $183.02 | Cross-model median | Primary reference |
| Current Market Price | $393.19 | — | 114.8% premium to composite median |
| Margin of Safety | −53.5% | vs. composite median | Critical risk flag |
DCF Sensitivity Range
| Scenario | DCF Output | Commentary |
|---|---|---|
| Bear Case | $373.63 | Modestly conservative discount rate / terminal growth assumptions |
| Base Case | $396.67 | Essentially ratifies current market price |
| Bull Case | $420.68 | Optimistic terminal growth and margin assumptions |
Reconciling the Divergence: A Critical Analytical Framework
The 54% divergence between the DCF central output ($396.67) and the composite median ($183.02) is the defining analytical challenge of this report. Bihzuun Research does not resolve this divergence by simply accepting the more favorable number. Rather, we offer the following interpretive framework:
Target Price & Confidence Level
Bihzuun Research’s 12–18 month fundamental price target of $200 reflects the earnings-power and asset-value floor, offered with low-to-moderate confidence. We acknowledge explicitly that defense sector tailwinds, long-backlog cash flow visibility, and persistent institutional demand for defense industrials in the current geopolitical regime could sustain the market price well above this level for an extended period. The BRS 4-star Buy rating reflects GD’s relative quality positioning within the sector, not an absolute valuation clearance at current prices.
5. Competitive & Industry Analysis
GD operates in an oligopolistic market structure in which competitive dynamics are shaped by program awards, congressional appropriations, and long-term platform selections rather than quarterly price competition. Understanding peer positioning is critical for interpreting both relative valuation and sector-level earnings read-throughs.
Defense Industrial Base Landscape
The U.S. aerospace and defense market is structurally concentrated, with the top five contractors — Lockheed Martin, RTX (Raytheon Technologies), Boeing Defense, Northrop Grumman, and General Dynamics — commanding an outsized share of Pentagon prime contract awards. This concentration reflects decades of consolidation driven by the capital intensity of modern defense platforms, regulatory complexity, and the government’s preference for established program managers with deep institutional experience.
| Peer | Market Position | Key Differentiator | Recent Q2 2026 Read-Through |
|---|---|---|---|
| Lockheed Martin (LMT) | Largest U.S. defense contractor (~25% market share) | F-35 program; missile systems; space | Revenue +10.5% YoY; beat estimates by 3.8%; guidance raised — positive GD read-through |
| RTX (RTX) | Second-largest; integrated missiles & aerospace tech | Pratt & Whitney engines; Raytheon missiles | Revenue +14.5% YoY; beat by 7.8%; stock surged — strong defense demand confirmed |
| Northrop Grumman (NOC) | Third; leadership in space and autonomous systems | B-21 Raider; space intelligence; autonomous platforms | Not yet reported (as of July 29) |
| General Dynamics (GD) | Fourth; land / naval defense anchor; Gulfstream commercial | Nuclear submarine duopoly; Gulfstream ultra |