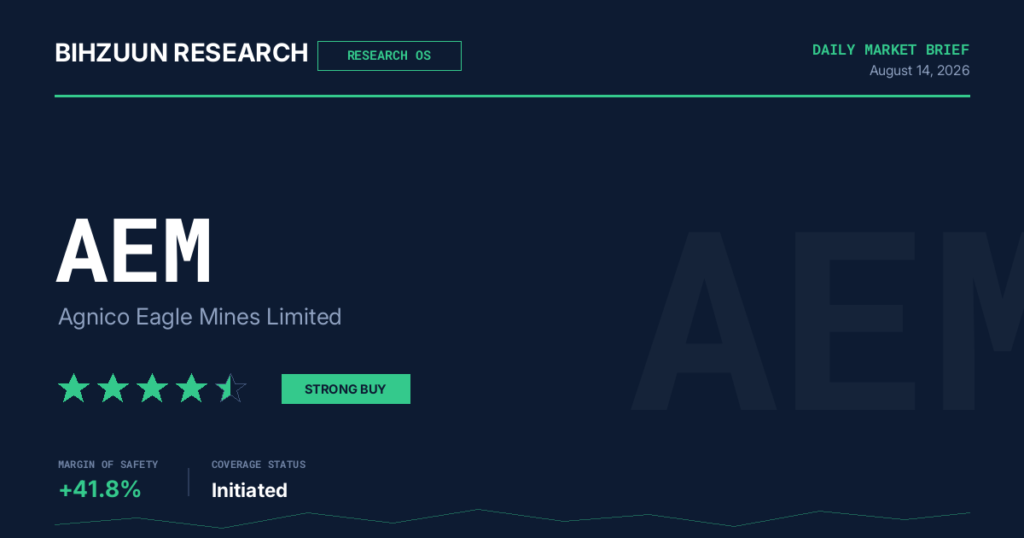
Agnico Eagle Mines (AEM) — Institutional Research Report
Bihzuun Research | Senior Gold Producer Coverage
1. Summary
| Metric | Value |
|---|---|
| Ticker | AEM (NYSE / TSX) |
| Bihzuun Research Score (BRS) | ★★★★★ Strong Buy |
| 12–18 Month Price Target | $250–$256 |
| Margin of Safety | 41.8% |
| Timeframe | 12–18 Months |
| Current Price | $180.36 |
The Margin of Safety shown above is the Bihzuun Value Filter (BVF) screening figure that gated AEM’s star rating. A separate multi-model composite figure is presented — and explicitly labeled — in Section 4.
2. Business Overview & Economic Moat
Agnico Eagle Mines is Canada’s largest mining company and the world’s second-largest gold producer. It has emerged in 2026 as the institutional “safe haven” of the senior gold complex — a designation earned through structural advantages rather than commodity-cycle luck. We assess AEM’s economic moat as the widest in the senior producer universe, resting on three reinforcing pillars:
- Jurisdictional quality. AEM operates almost exclusively in Tier-1 jurisdictions — Canada and Australia — offering developed infrastructure, skilled labor, established permitting regimes, and deep geological potential. This profile commands a persistent valuation premium and shields the company from the emerging-market headline risk currently dragging on peers.
- Cost-structure leadership. AEM sits in the second decile of the global AISC cost curve, with guided AISC midpoint near $1,475/oz — a structural advantage of roughly $200–$475/oz over Barrick ($1,760–$1,950/oz projected for 2026) and Newmont ($1,938/oz co-product in Q2 2026). This cost gap is the mechanical engine behind the profitability metrics detailed in Section 3.
- Balance-sheet fortress. With $3.46 billion in cash, net cash of $3.27 billion, and investment-grade ratings, AEM can self-fund growth and return capital simultaneously — a rarity among capital-intensive miners (see Section 3).
Reserve depth reinforces the moat: mineral reserves rose 2% to 55.4 million ounces and indicated resources 10% to 47.1 million ounces, with strategic expansions at Detour Lake and Hope Bay underpinning a visible long-duration growth narrative.
3. Financial Deep Dive
AEM’s financial profile is genuinely differentiated within mining. The company generated $11.9 billion in revenue and $4.46 billion in net income, producing a net margin of approximately 37.5% — a direct expression of the cost-curve advantage described in Section 2. Return on equity of 18.0% is notably strong for a capital-intensive producer, indicating efficient compounding against a $24.7 billion equity base, with EPS of $8.89.
Our internal scorecard registers a perfect 100 on both Growth and Valuation and a near-perfect 99 on Balance Sheet. The Income dimension scores a modest 24, reflecting a 0.94% dividend yield and conservative 19.1% payout ratio. We interpret this not as a weakness but as a deliberate capital-allocation posture: the vast majority of earnings are retained for reinvestment in a high-return pipeline and opportunistic buybacks (see Catalyst Monitor).
Balance sheet. Long-term debt of just $196 million against $24.7 billion of equity yields a long-term debt ratio of 0.8% — effectively negligible. Debt serviceability presents no material concern, and the company retains substantial flexibility for acquisitions, capex, and shareholder returns.
The composite scorecard aggregates to 81.4 out of 100 — a rating that affirms differentiated financial quality and valuation attractiveness while appropriately reflecting structural sector realities (gold price sensitivity, cost inflation) mapped in Section 6.
4. Multi-Model Valuation Assessment
AEM’s intrinsic value was assessed across five independent frameworks, with two contributing to the final composite:
- DCF (Declining Growth): $255.76
- Comparable Company: $249.83
- Composite Median Fair Value: $252.80
- Sensitivity Range: $242.34 (bear) to $269.61 (bull)
Three models were excluded for methodological reasons: the Graham Number ($99.31) was treated as a statistical outlier, as Graham’s formula is calibrated for asset-heavy industrials and systematically understates intrinsic value for high-margin, high-ROE businesses like AEM; the Dividend Discount Model was unstable because AEM’s growth rate exceeds its discount rate; and Earnings Power Value was inapplicable given the company’s 18.7% growth trajectory.
Against the current price of $180.36, the composite fair value of $252.80 implies a 5-Model Composite Margin of Safety of 40.2%. This differs by only 1.6 percentage points from the BVF screening margin of safety of 41.8% shown in the Summary Table. The BVF figure is the proprietary screening output that gated AEM’s star rating; the 40.2% composite is a separate, independently derived cross-check. Their tight alignment provides meaningful multi-framework corroboration and increases our confidence in the upside estimate.
We assign a 12–18 month price target of $250–$256 with moderate-to-high confidence, supported by the narrow band between the DCF and Comparable outputs and the limited implied downside to fair value from current levels.
5. Competitive & Industry Analysis
The competitive landscape shifted materially in AEM’s favor during 2026. The two industry titans are structurally impaired relative to AEM’s clean profile:
- Newmont has entered a self-described “trough year,” guiding to just 5.3 million ounces — a 10% year-over-year decline — while its AISC rose ~22% to $1,938/oz.
- Barrick remains a higher-risk, higher-reward emerging-market play, a profile increasingly unappealing to quality-rotation flows. Its resolution of the Nevada Gold Mines JV dispute with Newmont (creating a ~100-million-ounce Nevada complex) relieves some sector headline risk but does not alter AEM’s structural positioning.
AEM sits squarely in the sector’s re-rating zone: in a “flight to quality” cycle, producers that maintain AISC below $1,500/oz while growing production are being re-rated as “mini-majors.” This directly reinforces the moat and cost-leadership thesis of Section 2 and the profitability outcomes of Section 3.
Regime context. The prevailing neutral/rotation regime is structurally favorable but requires disciplined position sizing. Two concurrent flows benefit AEM: broad gold-miner inflows amid monetary and geopolitical uncertainty, and an intra-sector quality rotation toward AEM’s cleaner profile. Historical analogs (mid-2004 curve re-steepening; H2 2010 QE-era gold-equity outperformance) counsel that the opportunity is valid but terminal — its duration depends on how long the Fed can remain credibly neutral. A higher-for-longer signal at Jackson Hole could compress miner multiples even if gold prices hold, as rising discount rates work against NAV valuations.
6. Risk Mapping
- Barnat open-pit wall movement (execution risk). A July 1, 2026 rock-mass movement along the north wall prompted a precautionary suspension. The impact is material near-term: ~60,000–80,000 fewer ounces at Canadian Malartic in H2 2026, full-year output near the low end of the prior 3.3–3.5M oz range, and reductions of up to ~150,000 oz/year in 2027–2028. Critically, management does not expect any impact on the Odyssey mine or the pathway to 1M oz of annual Canadian Malartic production in the early 2030s — limiting long-term NAV impairment while elevating near-term earnings-revision risk ahead of Q3.
- Gold price & macro sensitivity. Gold’s rebound toward $4,500 prices in a more accommodative Fed path and rests on a fragile FOMC consensus — the June dot plot showed nine participants projecting at least one further hike, eight none, and one a cut (rates held at 3.50%–3.75% under Chair Warsh). A hawkish shift would quickly erode the strongest near-term bullish driver.
- Cost inflation. Q2 2026 AISC rose ~14% YoY to $1,459/oz and total cash costs rose 14% to $1,054/oz on higher royalties, labor, energy, and lower grades. Still well below peers, but the trajectory demands monitoring.
- Elevated capex. 2026 capex was revised up to $2.6–$2.8B (from $2.2–$2.4B) on Hope Bay construction approval, increasing free-cash-flow sensitivity to any gold pullback.
- Concentration/regime risk. As Section 5 notes, the re-rating thesis is terminal and sensitive to discount-rate shifts; position sizing should reflect elevated concentration risk.
7. Catalyst Monitor
Elevated-volatility macro window: August 19 – August 29.
- FOMC minutes (Aug 19): First granular view of the internal rate debate after the divided June dot plot; any hawkish tone is an acute headwind to gold and AEM’s margin narrative.
- Jackson Hole Symposium (Aug 27–29): Highest-stakes event; Chair Warsh’s remarks are the most consequential near-term catalyst for rate-sensitive commodities. Gold has historically corrected on hawkish Jackson Hole signals.
- BLS benchmark payroll revision (Aug 28): A material downward revision could paradoxically be gold-positive by softening the case for hikes.
Primary stock-specific catalyst — Q3 2026 earnings (~Oct 28, consensus EPS ~$3.47). Key variables: (1) whether Barnat remediation tracks to the Q4 restart; (2) any revision to 2027–2028 production guidance; and (3) AISC trajectory while processing lower-grade stockpile material. A clean quarter — echoing Q2’s $3.07 non-GAAP EPS, $3.8B revenue, $1.335B free cash flow, and $400M in buybacks — would materially close the valuation gap identified in Section 4.
Positive structural catalysts: guidance of 3.3–3.5M oz in 2026 with a targeted 20–30% growth over the next decade across five pipeline projects; a C$60M strategic investment in Cadillac Mines (stake to ~11.09%); a robust capital-return program (~$1.4B returned in 2025, $375M in Q1 2026) and a 12.5% dividend increase to C$0.45/quarter.
8. Investment Verdict — BRS & BRR Posture
★★★★★ Strong Buy
Bihzuun Research Rating (BRR): Strong Buy — high conviction, with a tactical volatility caveat.
AEM combines the widest moat in the senior gold producer universe (Section 2), a fortress balance sheet and differentiated profitability (Section 3), and a valuation offering a 41.8% BVF screening margin of safety corroborated by a closely aligned 40.2% five-model composite margin of safety (Section 4). The competitive backdrop — with Newmont in a trough year and Barrick carrying emerging-market complexity — is driving a quality re-rating that favors AEM directly (Section 5).
We temper this conviction with disciplined position sizing given two live overhangs: the Barnat production impact ahead of the Q3 print, and the elevated Aug 19–29 macro window in which a hawkish Fed signal could compress miner multiples even if gold holds (Sections 6 and 7). Net, we view current levels as an attractive entry into a differentiated, long-life senior producer, and reaffirm our $250–$256 target over a 12–18 month horizon.
Disclaimer
This report is produced by Bihzuun Research for informational purposes only and does not constitute investment advice, a recommendation, or an offer or solicitation to buy or sell any security. The Bihzuun Research Score (BRS) and Bihzuun Research Rating (BRR) reflect proprietary analytical frameworks and are subject to change without notice. All estimates, price targets, and margins of safety are based on assumptions that may prove incorrect; past performance and historical analogs are not indicative of future results. Investors should conduct their own due diligence and consult a qualified financial advisor before making investment decisions. Bihzuun Research and its affiliates may hold positions in the securities discussed.