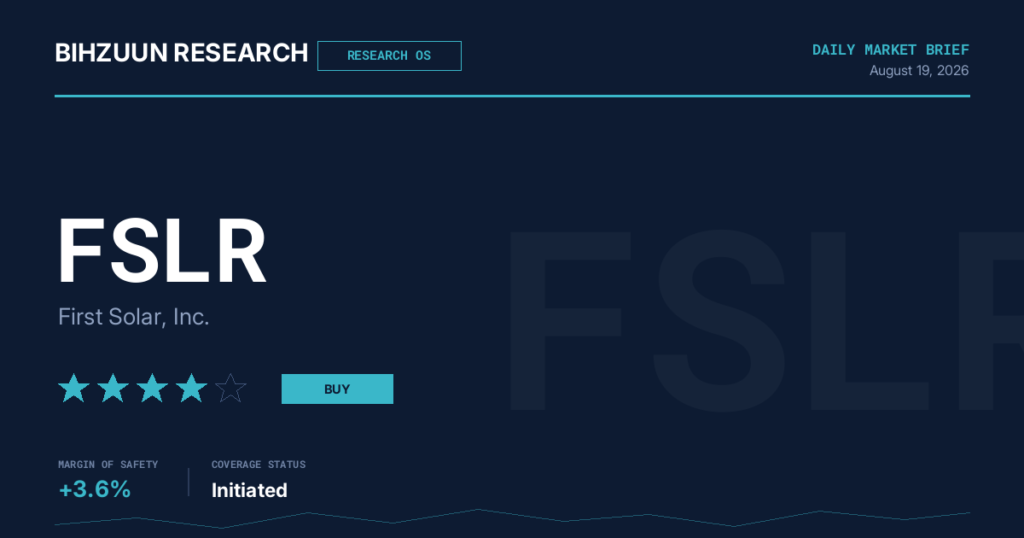
First Solar, Inc. (FSLR) — Institutional Research Report
Bihzuun Research | Coverage as of August 19, 2026 | Market Regime: Neutral
1. Summary Table
| Metric | Value |
|---|---|
| Ticker | FSLR (First Solar, Inc.) |
| Bihzuun Research Score (BRS) | ★★★★★ Buy |
| 12-Month Target Price | $190 (base-case range $175–$207) |
| Margin of Safety | +3.6% (BVF screening) |
| Timeframe | 12 months |
| Bihzuun Research Rating (BRR) | Constructive — High-Conviction Position for Patient Capital |
Prior coverage context: FSLR has been screened twice since July 21, 2026, passing both consecutive screens. The BVF screening margin of safety has trended modestly lower (4.3% → 3.6%), signaling a narrowing valuation cushion even as the business quality thesis holds firm.
2. Business Overview & Economic Moat
First Solar has evolved from a niche technology player into the undisputed industrial champion of the American solar industry. As the world’s largest thin-film solar module manufacturer, it occupies a genuinely differentiated competitive position at a moment when crystalline silicon peers are being crushed by global oversupply and margin collapse. We assess the economic moat as wide but not indestructible, resting on three reinforcing pillars:
- Technological differentiation: Cadmium telluride (CdTe) thin-film chemistry delivers superior energy yield in the hot, humid environments of the U.S. Sun Belt — precisely where the majority of new utility-scale capacity is being built. Ongoing CuRe technology development is exceeding performance expectations, sustaining the efficiency edge.
- Supply-chain independence: A domestic manufacturing footprint and independence from Chinese crystalline silicon supply chains insulate FSLR from Chinese price wars in the U.S., reinforced by Anti-Dumping and Countervailing Duties on Southeast Asian imports.
- Backlog depth: A contracted backlog of 45.1 GW valued at ~$13.6 billion (Q2 2026) with deliveries through 2030 provides among the deepest revenue-visibility profiles in the capital goods universe. The ~$4 billion 2024–2026 technology and R&D investment program sustains this pricing power.
The moat is real, but as detailed in the Risk Mapping section, it is exposed at the seams — a maturing tax-credit market, shifting political winds, and a technological race against advancing silicon alternatives all test its durability.
3. Financial Deep Dive
The operational fundamentals are, in isolation, compelling:
- Revenue: $5.22 billion, translating into net income of $1.53 billion — a net margin of roughly 29%, an unusually wide figure for a capital-intensive manufacturer.
- Return on Equity: 16.0% against an equity base of $9.54 billion — respectable and consistent with the company’s reinvestment posture.
- Balance sheet: Nearly pristine. Long-term debt of just $283 million against $9.54 billion of equity implies a debt ratio of 2.9%, leaving substantial financial flexibility and virtually no default risk. Approximately $1.7 billion in net cash at quarter-end reinforces the ability to outlast weaker rivals through solar cycles. This strength is captured accurately by a Balance Sheet score of 96/100.
- Margin expansion: Gross margin expanded to 57%, up 12 percentage points year-over-year, driven by an estimated $89 million net IEEPA tariff benefit, a higher mix of Section 45X-qualifying modules, and lower logistics costs.
- Capital allocation: No dividend obligation; all earnings retained for reinvestment, consistent with a growth-oriented posture.
The scorecard composite of 50.9/100 captures a genuine duality. Financial Quality (64) and Growth (67) are solid; the Balance Sheet (96) is a standout strength. But Valuation (0) and Income (15) drag the composite into middling territory. For a stock carrying no dividend yield and trading above every valuation model estimate except the DCF base case, the income component is structurally weak — a point that flows directly into the valuation assessment below.
4. Multi-Model Valuation Assessment
Valuation is where the FSLR picture becomes genuinely complicated, and intellectual honesty requires confronting a divergence between two distinct margin-of-safety figures rather than papering over it.
The Bihzuun Value Filter (BVF) screening margin of safety — the figure that actually gated FSLR’s BRS star rating — stands at +3.6%, implying the stock is roughly fairly valued on that framework.
A separate cross-check produces a different reading. The 5-Model Composite Margin of Safety is −21.1%, derived from a median intrinsic value of $173.50 against a current price of $220.01 — suggesting the stock is modestly overvalued on that basis. This composite figure is presented here, and only here, explicitly labeled to avoid any confusion with the BVF screening figure shown in the Summary Table.
Reconciling the divergence: The two figures differ primarily on methodology. The BVF framework weights near-term earnings-power and cash-flow inputs differently than the composite median, and applies growth assumptions that narrow the gap to fair value. The composite median instead blends several structurally conservative models. Neither figure should be dismissed — together they bracket a picture of a stock trading near, and by some measures modestly above, fair value.
| Model | Intrinsic Value | Note |
|---|---|---|
| DCF (Declining) | $206.88 | Closest to current price; base-case anchor |
| EPV | $178.13 | Mid-range earnings-power estimate |
| Graham Number | $168.87 | Conservative asset/earnings blend |
| Comparable | $125.40 | Drags low; reflects peer-group compression |
| DDM | N/A | Inapplicable — zero dividend policy |
| Composite Median | $173.50 | Central tendency; wide confidence interval |
The four applicable models span $81.48 — a 65% spread even after outlier exclusion. This residual disagreement is a direct warning: FSLR is genuinely difficult to value with precision given its capital-intensive transition profile and subsidy-dependent revenue mix. Our 12-month base-case target of $175–$207 (midpoint ~$190) reflects this range, with confidence characterized as moderate at best.
5. Competitive & Industry Analysis
Primary competition comes from Chinese silicon giants — JinkoSolar, LONGi, and Trina Solar. Throughout 2024–2025, Chinese capacity expanded to 1,200 GW, far exceeding global demand and collapsing module prices. This structural glut is a double-edged sword: it has decimated international peers but also pressured average selling prices where FSLR sells internationally.
The ASP divergence is one of the most important structural dynamics in the thesis. U.S. gross bookings of ~1.9 GW carried an ASP of ~$0.36/watt, versus ~1.1 GW of Indian bookings at ~$0.20/watt. FSLR’s domestic-market insulation — the source of its premium pricing — is therefore central to its earnings power, and directly tied to the U.S. policy regime discussed under Risk Mapping.
The industry backdrop is turning: 2026 is projected to mark the first year of negative global PV demand growth in over a decade, with module demand forecast to decline to 529–624 GWdc from an estimated 653–706 GWdc in 2025. Against this, FSLR’s balance sheet strength (Section 3) and net-cash position provide the durability to persist where competitors fail — and emerging demand from hyperscalers and data-center developers offers a secular tailwind independent of the rate cycle.
6. Risk Mapping
- Regulatory (most material): The One Big Beautiful Bill Act (signed July 4, 2025) restructures the Section 45X Advanced Manufacturing Production Tax Credit. For taxable years beginning after 2026, integrated-component eligibility rules and a 65% U.S.-content threshold apply. This December 31, 2026 cliff is a latent earnings risk — FSLR’s guidance incorporates an estimated $2.10–$2.19 billion in 45X credits. Pending Treasury/IRS guidance could reprice this stream in either direction.
- Legal overhang: A securities class action (lead plaintiff deadline August 24, 2026) covers purchasers between February 26, 2025 and February 24, 2026, alleging overstated tariff-management capacity and understated Malaysian/Vietnamese underutilization impacts. While such actions frequently resolve without material financial impact, headline risk and constrained guidance latitude are near-term concerns.
- Execution: Booking selectivity awaiting Section 232 tariff and FEOP rulemaking clarity has decelerated net bookings — backlog contracted from 47.9 GW (Q1) to 45.1 GW (Q2).
- Macro / duration sensitivity: Long-dated project economics make FSLR sensitive to interest rates, financing conditions, and renewable-policy sentiment — a factor amplified by the imminent catalysts below.
- Valuation / income cushion: As flagged in Sections 3–4, the composite margin of safety is negative and there is no dividend cushion to soften downside.
7. Catalyst Monitor
- FOMC Minutes (Aug 19): Texture of the July 28–29 debate; a hawkish tone could reprice duration-sensitive solar names. Regime-setting rather than direct.
- Q2 GDP Second Estimate (Aug 26): A downward revision from the 1.5% advance print would reinforce recession risk and could dampen utility capex sentiment.
- Jackson Hole Symposium (from Aug 27): The most significant near-term macro catalyst. Chair Warsh’s posture ahead of the September 15–16 FOMC carries outsized beta for solar; a dovish tilt would compress discount rates applied to FSLR’s long-duration backlog. With FSLR down 4.3% YTD versus the S&P 500’s +13.3%, positive rate catalysts carry asymmetric recovery potential.
- Q3 2026 Earnings (Oct 29): The most significant company-specific catalyst. FSLR delivered a +43.07% EPS surprise for Q2 2026. A repeat beat, backlog stabilization, and any positive IRS 45X guidance could materially close the valuation gap.
- 45X Treasury/IRS Guidance (through year-end): Increasingly priced as a tail risk; the clearest binary swing factor on FSLR’s earnings stream.
Historical-analog context (H2 2019, 1994–1995, H2 2003) collectively suggests the near-term setup is not momentum-driven; FSLR’s path depends on company-specific catalysts — a clean Q3 print, 45X clarity, and stabilizing bookings — rather than sector beta.
8. Investment Verdict — BRS Rating & BRR Posture
★★★★★ Buy
Bihzuun Research Rating (BRR): Constructive — High-Conviction Position for Patient Capital.
FSLR presents a clear tension: genuinely strong fundamentals — a 29% net margin, a near-pristine balance sheet (96/100), deep backlog visibility, and a wide-but-testable moat — set against a valuation that is fairly valued at best on the BVF framework (+3.6% screening margin of safety) and modestly stretched on the 5-model composite cross-check (−21.1%). The narrowing BVF cushion across consecutive screens (4.3% → 3.6%) reinforces that the entry point is no longer a bargain.
The BRS Buy rating reflects business quality and catalyst optionality — Q3 earnings, 45X regulatory clarity, and a potential dovish rate pivot at Jackson Hole all offer asymmetric upside from a stock that has lagged the broad market YTD. But the balanced risk/reward, the securities litigation overhang, the December 2026 45X cliff, and a wide inter-model valuation spread argue for disciplined position sizing and patience for pullbacks rather than aggressive accumulation at current prices. Our 12-month target midpoint of ~$190 sits below the current price, consistent with a rating anchored in quality and catalyst potential rather than present-day undervaluation.
Bihzuun Research Disclaimer: This report is produced by Bihzuun Research for informational purposes only and does not constitute investment advice, a recommendation, or an offer or solicitation to buy or sell any security. The Bihzuun Research Score (BRS) and Bihzuun Research Rating (BRR) reflect proprietary analysis and modeled estimates subject to material uncertainty, including the wide inter-model valuation spread discussed herein. Intrinsic value estimates, target prices, and margin-of-safety figures are model outputs, not guarantees. Investors should conduct their own due diligence and consult a qualified financial advisor before making any investment decision. Past performance and prior screening results are not indicative of future results.