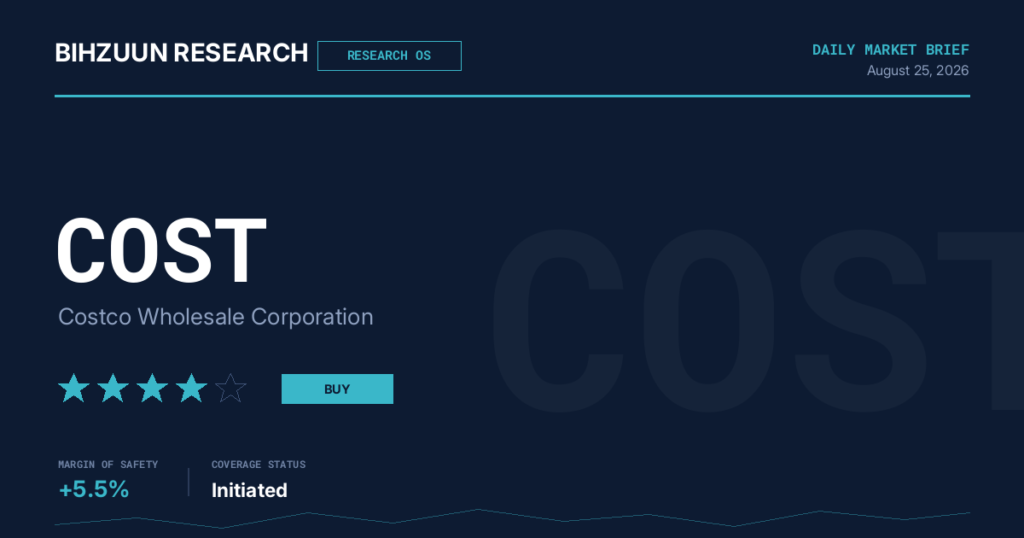
Costco Wholesale Corporation (COST) — Bihzuun Research Report
Institutional Equity Research | Consumer Staples — Warehouse Club Retail
1. Summary Table
| Metric | Value |
|---|---|
| Ticker | COST |
| Bihzuun Research Score (BRS) | ★★★★★ Buy |
| Target Price (12–18 mo) | $900 – $1,050 |
| Margin of Safety (BVF Screening) | 5.5% |
| Timeframe | 12–18 months |
| Current Price | $971.40 |
Coverage note: COST has been screened twice since August 7, 2026, passing both consecutive screens. The BVF screening margin of safety has trended modestly lower from 5.6% to 5.5%, a declining but still positive buffer that continues to gate the 4-star rating.
2. Business Overview & Economic Moat
Costco Wholesale is a global leader in the warehouse club and wholesale retail sector, operating a low-margin, high-velocity membership model that converts a deeply loyal customer base into a recurring, annuity-like revenue stream. The company anchors $275.2 billion in revenue on a remarkably lean equity base, producing operational efficiency metrics that rank among the strongest in large-cap retail.
The economic moat is wide, multi-layered, and structurally durable, resting on three reinforcing pillars:
- Membership lock-in: A 90.5% global renewal rate (92.2% in the U.S. and Canada) sits well above the ~80% industry benchmark, with executive memberships now driving 75% of sales penetration. The September 2024 fee increase continues to flow through as members renew. On April 8, 2026, Costco returned $5.3 billion via a $12-per-share special dividend — a direct signal of the health of this recurring revenue engine (see Section 3 for the balance-sheet flexibility that funds such returns).
- Private-label dominance: High-quality own-brand products differentiate the assortment and deepen member stickiness.
- Scale-driven purchasing power: Costco’s revenue dwarfs BJ’s ~$20 billion, creating a structurally unbridgeable sourcing advantage (elaborated in Section 5).
The historically weakest edge of the moat — physical-only friction — is narrowing. Online sales rose nearly 22% in the latest reported quarter and digitally enabled comparable sales surged 20.5%, outpacing overall growth. Third-party partnerships (e.g., Instacart) extend reach to a younger cohort, though that cohort renews at lower rates than older members — a nuance worth monitoring against the renewal-driven moat thesis above.
3. Financial Deep Dive
Costco’s operating financials are of exceptional quality, and the balance sheet provides substantial strategic flexibility.
- Revenue: $275.2 billion — extraordinary scale.
- Net income: $8.1 billion; EPS: $18.24.
- Return on equity: 27.8% — a standout figure against only $29.2 billion in equity.
- Long-term debt: $5.7 billion; debt ratio: 16.4% — conservative by any measure, with debt serviceability a non-issue.
- Dividend yield: 0.57%; payout ratio: 30.4% — disciplined capital allocation favoring reinvestment.
- Financial quality scorecard: 100; balance sheet score: 80.
The conservative leverage profile is precisely what enabled the $5.3 billion April 2026 special dividend referenced in Section 2 without impairing reinvestment capacity. In short, the operational and financial-quality picture is unambiguously strong. The tension in this name — as the next section makes explicit — is not business quality but price.
4. Multi-Model Valuation Assessment
Costco is one of the more analytically interesting cases in large-cap retail because its financial quality and its valuation picture point in nearly opposite directions. Two distinct margin-of-safety figures appear in this analysis, and intellectual honesty requires we distinguish them clearly:
- BVF Screening Margin of Safety: 5.5% — the figure that actually gates COST’s star rating. It represents a narrow but technically positive buffer at current prices and supports the 4-star Buy designation. This is the figure shown in the Summary Table above.
- 5-Model Composite Margin of Safety: −75.3% — a separate, multi-model construct implying the stock at $971.40 is deeply overvalued relative to a composite intrinsic value of $240.01.
These two figures diverge by roughly 81 percentage points, and that divergence must be acknowledged directly rather than selectively cited. The reason is traceable to model construction. The composite median is anchored to the Comparable model ($240.01) and the Graham Number ($164.18) — both structurally unsuited to a premium-quality membership retailer priced on franchise value and recurring cash flow rather than book assets or cyclical earnings multiples. The DDM Gordon model produces $490.84 — more generous but still well below market. Meanwhile, the DCF Declining model ($1,025.15) was excluded as a statistical outlier, yet it is the only model that approximates current market pricing, and the sensitivity analysis (base case $1,025.15, bull case $1,086.14) suggests the excluded DCF may be capturing franchise economics the retained models systematically miss.
Even after outlier exclusion, the retained models disagree by 199% ($164.18 to $490.84) — an unusually wide spread the data itself flags as a residual disagreement warning. Accordingly, the $240.01 composite should not be treated as a reliable intrinsic-value anchor. Weighting the DCF and franchise-quality framework above the Graham and Comparable outputs, our reasonable target sits in the $900–$1,050 range over a 12–18 month horizon, with low-to-moderate confidence given the model disagreement.
5. Competitive & Industry Analysis
Costco holds roughly 62% of the U.S. warehouse club market, with Sam’s Club (~31%) and BJ’s Wholesale (~7%) rounding out a three-operator structure that has been remarkably stable since the 1990s. The cost of building a competitive warehouse club from scratch — purchase volume, member trust, supply-chain depth — has effectively closed the door on new entrants, reinforcing the durability of the moat described in Section 2.
- Sam’s Club (~600 locations, ~$92 billion revenue): Shifting to aggressive expansion — 15 new clubs annually atop 30 previously announced — leveraging Walmart’s supply chain, but trailing Costco on revenue per warehouse and member retention.
- BJ’s: East Coast-focused with a broader SKU count; lacks Costco’s global scale and private-label prestige, constraining national expansion.
- Asymmetric long-run threats: Amazon (competing on convenience) and Aldi (~2,800 U.S. stores, aggressive grocery pricing, no fee barrier).
International momentum is a differentiator: Q2 FY2026 comparable sales grew 5.9% (U.S.), 10.1% (Canada), and 13% (international) — strong performance that flatters the consolidated comp while introducing currency sensitivity (see Section 6).
6. Risk Mapping
- Valuation risk (primary): Trailing P/E of 47.67 as of August 22, 2026 — ~25% above the 10-year median of 38.01 and more than double the industry average. With the 10-year Treasury near 4.71–4.74%, the embedded equity risk premium is razor-thin. Any terminal-rate upward revision or earnings deceleration could trigger a sharp de-rating. This valuation risk is the practical counterweight to the strong fundamentals in Section 3 and the negative composite in Section 4.
- Tariff overhang: ~One-third of U.S. sales are imported goods; over $250 million in extra tariff costs incurred since duties expanded — manageable versus revenue but margin-compressing given management’s deliberate choice to absorb a portion rather than fully pass through. Oral arguments in Costco’s tariff case are expected late 2026 or early 2027, prolonging cost uncertainty.
- Macro / demand: Rising labor and freight costs, membership fatigue amid competing subscriptions, and discretionary-spending softness that could pressure traffic and basket size.
- FX exposure: Strong international comps introduce currency sensitivity to consolidated results.
- Behavioral: COST historically lags aggressive broad-market rallies — it does not chase equity waves upward.
7. Catalyst Monitor
- ⚑ CRITICAL — Jackson Hole (Aug 27–29): Fed Chair Kevin Warsh’s tone on the September rate trajectory will directly pressure COST’s premium multiple. A hawkish surprise would widen the already-thin risk premium on a ~48x stock; a dovish pivot would be constructive.
- ⚑ MEDIUM — BEA Q2 GDP Second Estimate (Aug 26): A downward revision from the 1.5% advance estimate could paradoxically pressure COST via rotation toward lower-multiple staples.
- September 3: August 2026 monthly net sales — an early read on Q4 consumer momentum.
- September 11 / September 16: CPI data and FOMC meeting (dot plot update) — the macro bookend determining the rate environment into which COST reports.
- September 24 (approx.): Q4 FY2026 earnings — analysts project diluted EPS of $6.51, up 10.9% year-over-year; the company has beaten estimates in three of the last four quarters.
8. Investment Verdict — BRS Score & BRR Posture
★★★★★ Buy
Bihzuun Research Rating (BRR) Posture: Constructive — Accumulate on Weakness.
Costco’s business quality is not in question. The moat is wide and durable, financial quality is exceptional, and the franchise generates consistent excess returns. The 4-star BRS Buy rating is anchored by a positive — if narrow — BVF screening margin of safety of 5.5%, which has held through two consecutive screens.
The core tension is valuation. At a P/E ~25% above its 10-year median with long-end yields near cycle highs, COST offers little room for negative surprise, and the sharply negative 5-Model Composite margin of safety (−75.3%) underscores that much of the company’s quality is already priced in. We reconcile the two figures explicitly: the BVF screening figure gates the rating and reflects franchise-aware pricing dynamics, whereas the composite is depressed by book-value and comparable-multiple models poorly suited to a premium membership retailer — a limitation the wide model disagreement (199%) makes evident.
Our target range of $900–$1,050 reflects the DCF and franchise-quality frameworks. Given the imminent Jackson Hole catalyst and the September 24 earnings print, we favor disciplined accumulation on weakness toward the $880–$900 range, where the implied earnings yield becomes meaningfully more competitive against current Treasury rates. High-conviction, quality-compounder exposure is warranted — but position sizing and entry discipline matter more than usual at this valuation.
Disclaimer
This report is produced by Bihzuun Research for informational purposes only and does not constitute investment advice, a recommendation, or an offer or solicitation to buy or sell any security. The Bihzuun Research Score (BRS) and Bihzuun Research Rating (BRR) reflect proprietary analytical frameworks and are subject to change without notice. Valuation model outputs involve significant assumptions and material uncertainty; readers should note the wide model disagreement flagged herein. Past performance and prior screening results are not indicative of future results. Investors should conduct their own due diligence and consult a qualified financial adviser before making any investment decision. Bihzuun Research and its affiliates may hold positions in the securities discussed.