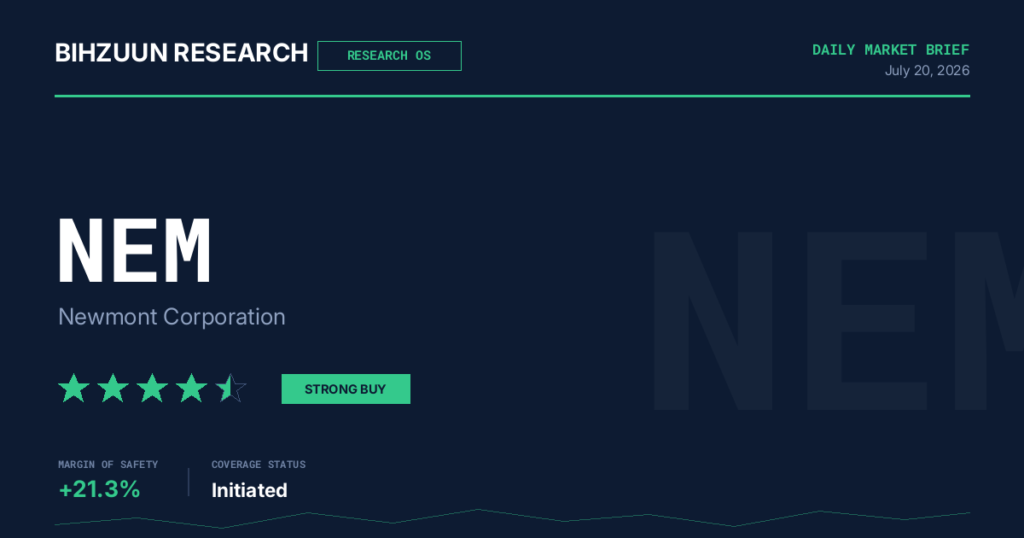
Bihzuun Research — Institutional Equity Report
Newmont Corporation (NYSE: NEM) | July 20, 2026
| Field | Detail |
|---|---|
| Ticker / Exchange | NEM / NYSE |
| Sector / Industry | Materials / Gold Mining |
| Current Price | $89.70 |
| Bihzuun Research Score (BRS) |
★ ★ ★ ★ ★ Strong Buy |
| 12-Month Central Price Target | $100.00 (range: $95–$110) |
| Composite Model Median Fair Value | $94.45 |
| Margin of Safety (Current) | 21.3% (improving; prior screen: 20.9%) |
| Screens Passed | 2 of 2 consecutive screens since 2026-07-15 |
| Investment Timeframe | 12–24 months |
| Bihzuun Research Rating (BRR) | Moderate-to-Strong Accumulate — with event-risk discipline |
| Report Date | July 20, 2026 |
| ⚠ Imminent Catalyst Flag | Q2 2026 Earnings Release: July 23, 2026 (3 trading days) — binary near-term risk |
1. Business Overview & Economic Moat
Corporate Profile
Newmont Corporation is the world’s largest gold mining enterprise by production, reserve base, and market capitalisation. The company operates a globally diversified portfolio of producing mines and development projects spanning the Americas (Nevada, Colorado, Suriname, Mexico, Peru, Argentina), Australia (Boddington, Tanami), Papua New Guinea (Lihir), and sub-Saharan Africa. The 2023 acquisition of Newcrest Mining — the largest transaction in the history of the gold sector — materially expanded Newmont’s production footprint and introduced meaningful copper optionality, transforming the company from a pure-play gold major into a polymetallic producer of strategic importance. Under President and CEO Natascha Viljoen, who assumed the role in January 2026, the organisation is navigating a post-integration rationalisation phase that will define shareholder value delivery through the balance of the decade.
Moat Assessment
- Scale & Reserve Depth: Newmont’s proven and probable reserve base is the largest in the global gold industry, providing multi-decade production visibility that competitors cannot replicate without transformative M&A. The Newcrest integration added tier-1 assets — Cadia, Lihir, Boddington, and Tanami — each with multi-decade mine lives and low-cost production profiles. The Red Chris block cave transition extends productive life into the 2040s and introduces copper output at scale, reinforcing long-duration moat characteristics.
- Geographic Diversification: Production spread across stable jurisdictions in Australia and the Americas provides meaningful downside protection against single-country regulatory disruption, a structural differentiator relative to peers with concentrated African or frontier exposure. This diversification underpins Newmont’s premium valuation multiple versus mid-tier peers and contributes to the consistent passage of our proprietary screening criteria over two consecutive reviews.
- Balance Sheet Fortress: A net cash balance sheet ($2.1 billion net cash, $7.6 billion gross cash) following record Q1 2026 free cash flow generation of $3.1 billion is among the most formidable financial positions in the global mining sector. This architecture enables counter-cyclical capital allocation — the freshly authorised $6.0 billion buyback programme is a direct expression of management confidence in intrinsic value at current prices, and its execution at or below current levels is mathematically accretive given the discount to fair value detailed in Section 4.
- Synergy Runway: The Newcrest acquisition is targeted to deliver in excess of $500 million in annualised synergies. Realisation of this figure over the 2026–2028 period represents a material and underappreciated source of earnings growth that is not fully reflected in consensus estimates, in our assessment.
- Moat Durability Caveats: The moat is wide but faces incremental pressure from rising input costs — gold costs applicable to sales rose approximately 7% year-over-year in Q1 2026, and all-in sustaining costs (AISC) are guided at $1,680 per ounce for 2026, a level that compares unfavourably to Agnico Eagle’s Q1 2026 reported AISC of $1,483 per ounce. Cost structure convergence among majors, if sustained, would narrow Newmont’s operating margin premium and is a risk factor cross-referenced explicitly in Section 6.
2. Financial Deep Dive
Income Statement Quality
- Revenue: $22.1 billion — a revenue base that reflects the full consolidation of Newcrest assets and the powerful operating leverage embedded in gold mining at elevated commodity prices.
- Net Income: $7.085 billion — net profit margin of approximately 32%, exceptional for large-cap materials and a direct expression of the pricing power gold producers command in high-bullion environments. This margin quality distinguishes Newmont from industrial miners and warrants the premium multiple embedded in the DCF and Comparable analyses.
- EPS: $6.41 — forms the earnings anchor for the Graham Number and Earnings Power Value calculations detailed in Section 4. The perfect Growth sub-score of 100 within our BRS framework indicates that the earnings trajectory has been accelerating meaningfully over the measurement period, providing structural support for bull-case DCF assumptions.
Balance Sheet Architecture
- Equity Base: $33.9 billion — substantial, providing a conservative anchor for book-value-based valuation methodologies.
- Long-Term Debt: $5.115 billion — yielding a long-term debt ratio of 13.1%, among the lowest leverage profiles in the global mining universe. Debt serviceability is comfortable at current earnings levels, and the net cash position means that refinancing risk is effectively non-existent in the medium term.
- Return on Equity: 20.9% — a figure that, when set against a 13.1% debt ratio, is not a product of balance sheet leverage. This is genuine operational value creation, a distinction that institutional allocators weight heavily in quality screens.
Capital Allocation & Income Profile
- Dividend Yield: 1.14% — modest in absolute terms and consistent with a management philosophy of retaining capital for reinvestment and balance sheet resilience in a cyclical industry. The Income sub-score of 28 out of 100 in our BRS framework accurately captures the yield gap relative to income-oriented mandates.
- Payout Ratio: 15.9% — the retained earnings capacity is the more consequential figure here. At current EPS levels, approximately $5.40 per share is retained annually, providing the financial fuel for the $6.0 billion buyback programme and organic capital deployment.
- Buyback Programme: The $6.0 billion repurchase authorisation, announced following the record Q1 2026 result, is the most significant near-term capital allocation mechanism available to management. At $89.70, the programme can retire approximately 66.9 million shares — approximately 8% of the outstanding float — a mathematically material per-share accretion catalyst that is independent of gold price direction.
Sub-Score Interpretation
| BRS Sub-Dimension | Score | Bihzuun Interpretation |
|---|---|---|
| Growth | 100 / 100 | Exceptional earnings trajectory acceleration; sets a high execution bar for 2027 |
| Valuation | 18 / 100 | Market pricing embeds significant optimism; narrow margin of safety at spot |
| Income | 28 / 100 | Yield uncompetitive for income mandates; buyback is the preferred return mechanism |
3. Multi-Model Valuation Assessment
Model Summary
| Valuation Model | Output | Premium / (Discount) to Spot | Bihzuun Commentary |
|---|---|---|---|
| Graham Number | $66.48 | (25.9%) | Conservative book-and-earnings anchor; market correctly prices quality premium above this floor |
| Earnings Power Value | $80.13 | (10.7%) | Normalised earning capacity without growth attribution; undervalues the synergy and buyback catalysts |
| DCF — Declining Model | $108.77 | +21.3% | Base case; 60% confidence contingent on gold price stability and Newcrest execution |
| DCF — Bull Case | $114.96 | +28.2% | Requires gold at or above $4,400/oz and AISC improvement; achievable in H2 2026–2027 cycle |
| Comparable (Peer) Model | $121.87 | +35.9% | Reflects the 20–25% peer discount at which NEM currently trades; re-rating catalyst dependent |
| Gordon Growth DDM | N/A — Unstable | — | Growth assumptions exceed discount rate parameters; model inapplicable, not negative |
| Composite Median | $94.45 | +5.3% | Mechanically narrow; DCF and Comparable anchors justify central target above median |
Price Target Construction
- Central 12-Month Target: $100.00 — represents approximately 11.5% upside from spot, anchored in the DCF base case and partially discounting the Comparable model’s full peer re-rating to preserve intellectual honesty on execution risk.
- Bull Case Target: $110.00 — requires gold stabilisation above $4,400 per ounce, AISC improvement toward $1,600 per ounce, and constructive resolution of the Nevada Gold Mines (NGM) dispute with Barrick.
- Bear Case / Support: $78.00–$82.00 — approximates the Earnings Power Value range and represents the level at which buyback activity would become maximally accretive; a gold price sustained below $3,700 per ounce would be required to pressure shares to this level.
- Margin of Safety Trend: The improving MoS trajectory — 20.9% to 21.3% across two consecutive screens — confirms that the risk-adjusted entry opportunity has modestly widened despite broadly stable spot prices, likely reflecting consensus EPS revision dynamics. This improving trend is a constructive secondary signal within our framework.
Valuation Sensitivity — Key Variables
| Variable | Bear Scenario | Base Scenario | Bull Scenario |
|---|---|---|---|
| Gold Price (avg. realised) | $3,700/oz | $4,100/oz | $4,500/oz |
| AISC | $1,750/oz | $1,680/oz | $1,600/oz |
| Implied DCF Fair Value | ~$72–$78 | ~$100–$109 | ~$112–$121 |
| NGM Litigation Outcome | Adverse ruling / production disruption | Negotiated settlement | Full remedy / damages awarded |
4. Competitive & Industry Analysis
Peer Positioning Matrix
| Company | Production Scale | 2026 AISC (Guided/Reported) | Balance Sheet | Key Differentiation vs. NEM |
|---|---|---|---|---|
| Newmont (NEM) | #1 globally; ~6M oz target | $1,680/oz (guided) | Net cash; $7.6B gross cash | Largest reserve base; polymetallic optionality; $6B buyback |
| Barrick Gold | #2 globally | Not disclosed (peer est.) | Moderate leverage | Copper growth (Reko Diq); also NEM’s NGM JV operator — structurally complex |
| Agnico Eagle | ~3.4–3.6M oz annually | $1,483/oz (Q1 2026 reported) | Conservative | 197 bps AISC advantage; Canadian jurisdictional premium; operational consistency |
| Kinross Gold | ~2.0M oz annually | $1,300/oz (reported) | Improving | Lowest-cost peer benchmark; 21% revenue growth; doubles net earnings |
| AngloGold Ashanti | Mid-tier major | N/A | Moderate | African and Americas exposure; less diversified than NEM |
Competitive Dynamics — Bihzuun Assessment
- The Cost Structure Gap is the Critical Near-Term Issue: Agnico Eagle’s $1,483/oz AISC represents a 197 basis point structural advantage over Newmont’s $1,680/oz guidance at the current gold price environment of approximately $4,038/oz. This gap translates directly into superior free cash flow margins for Agnico and is the primary argument used by analysts rotating away from NEM within the gold major peer group. Narrowing this gap — through Newcrest synergy realisation and sustaining capital normalisation — is one of management’s most critical execution deliverables in 2027.
- NEM’s Scale Moat Remains Decisive at the Institutional Level: For sovereign wealth funds, large pension allocators, and commodity-focused long-only strategies requiring significant position size, Newmont’s daily liquidity and reserve depth are prerequisites that Agnico Eagle and Kinross simply cannot match. Scale is not merely a financial metric — it is a structural access consideration that concentrates large-cap gold flows into NEM disproportionately.
- Barrick Relationship — Structurally Awkward: The fact that Barrick is simultaneously Newmont’s largest industry rival and the operating partner of the Nevada Gold Mines JV represents a governance and strategic risk with no clean resolution. The current litigation (detailed in Section 6) crystallises what has been a structurally uncomfortable arrangement since 2019. This situation has no clear precedent in recent mining history and introduces litigation-driven volatility that is fundamentally unpriceable until discovery and judicial proceedings advance.
- Kinross as Cost Benchmark: Kinross Gold’s $1,300/oz AISC, 21% revenue growth, and doubled net earnings in the most recent period set a performance benchmark that implicitly challenges the premium multiple assigned to Newmont’s scale. Investors willing to accept lower liquidity can access superior near-term cost efficiency at Kinross — a relative value argument that constrains NEM’s re-rating velocity even as the structural thesis remains intact.
5. Risk Mapping
Risk Register
| Risk Factor | Severity | Probability (Near-Term) | Bihzuun Assessment |
|---|---|---|---|
| Gold Price Decline (sustained below $3,700/oz) | Critical | Low-Moderate | Dominant P&L variable; a $300/oz decline compresses EBITDA by approximately $1.8B at current production rates. Fed hawkishness (July 29 FOMC) is the most proximate catalyst for downside gold pressure. World Gold Council fair value model places H2 2026 gold at $4,100/oz with a tolerance band of $3,895–$4,305 — NEM’s $4,500/oz guidance assumption sits above the upper bound. |
| Q2 2026 Earnings Miss / Guidance Revision | High | Moderate-High | Production guided below Q1’s already-weak 1.3M oz; gold prices likely averaged $4,100–$4,400 vs. $4,500 guidance in Q2. Risk of a formal guidance cut on July 23 is real and represents the highest-density binary risk in the near-term calendar. Analyst consensus of $2.12–$2.20 EPS may prove optimistic. |
| NGM / Barrick Litigation | High | Elevated (ongoing) | The formal default notice (February 3, 2026) and subsequent Nevada court proceedings introduce unquantified production and financial risk. Newmont’s 38.5% minority stake provides no operational control — Barrick as operator has structural leverage. Preliminary hearings scheduled for May 2026; July 23 earnings call will likely be the first major management communication on litigation status since then. |
| AISC Cost Escalation | Moderate-High | High (guided) | Management has pre-signalled a significant sequential rise in unit costs in Q2 2026. This is the expected trough of the cost cycle; however, if AISC surprises above $1,750/oz, the peer discount would likely widen rather than narrow, and the Comparable model’s $121.87 fair value estimate would require material downward revision. |
| C-Suite Transition Risk | Moderate | Low-Moderate | New CEO Natascha Viljoen (January 2026) and interim CFO following Karyn Ovelmen’s mid-2025 resignation represent concurrent leadership transitions. Q2 earnings will be an early test of management’s communications credibility. Investor confidence in the new team’s operational grip on post-integration complexity is not yet established. |
| Geopolitical / Jurisdictional Risk | Moderate | Low (baseline) | Operations in Papua New Guinea, Ghana, Suriname, and Mexico carry inherent political economy risks. Geographic diversification partially mitigates concentration, but PNG (Lihir) and Mexico (Peñasquito) are the highest-sensitivity jurisdictions to monitor. |
| Macro Rate Regime (Fed Hike) | Moderate | Moderate | Goldman Sachs has delayed its rate cut forecast to 2027 and introduced a rate hike probability before year-end. A July 29 hike — six days after the earnings print — would pressure real yields, USD, and gold simultaneously, creating a compounding negative catalyst sequence with maximum impact in the 5–10 trading days post-earnings. |
| Valuation Sub-Score (18/100) | Moderate | Persistent | The market has already priced meaningful optimism into NEM. This is not an acute risk but a persistent constraint on upside velocity. Any earnings deceleration relative to the perfect Growth sub-score expectation could trigger a sharp re-rating toward the $80–$82 support band identified in Section 3. |
| Cadia Seismic Recovery | Moderate | Watch | Cadia is among the highest-value assets in the portfolio. Recovery timeline and production ramp commentary on July 23 will be a key market-moving data point. |
6. Catalyst Monitor
⚠ Imminent Catalyst — Priority Flag
| Catalyst | Date | Bihzuun Classification | Expected Market Impact |
|---|---|---|---|
| Q2 2026 Earnings Release | July 23, 2026 (3 trading days) | BINARY / DOMINANT | The highest-priority near-term event. Key watch items: (1) Q2 EPS vs. $2.12–$2.20 consensus; (2) AISC realised vs. $1,680/oz guidance; (3) H2 production and gold price assumption revisions; (4) Cadia seismic recovery update; (5) NGM litigation commentary. A beat on AISC or constructive NGM tone could catalyse 8–12% upside; a guidance cut would likely accelerate the peer discount to 30%+. |
| FOMC Rate Decision | July 29, 2026 (9 trading days) | MACRO / HIGH SENSITIVITY | A rate hike would simultaneously pressure gold spot and NEM’s H2 earnings trajectory. The 6-day gap between earnings and FOMC creates a compounding event risk corridor — position sizing must account for both. A hold decision would be constructive for gold; a cut would be strongly bullish but is consensus-assigned a low probability. |
| Buyback Execution Updates | Ongoing / Q3 2026 | STRUCTURAL POSITIVE | Quantitative disclosure of shares retired under the $6.0B programme will be a recurring positive catalyst in quarterly filings. At current prices, buyback execution is maximally accretive and communicates management’s confidence in intrinsic value — a credibility signal for institutional holders. |
| NGM Litigation Proceedings | Ongoing / Nevada Courts | BINARY / UNQUANTIFIED | Any settlement announcement, adverse ruling, or escalation would move the stock materially. The inability to probability-weight outcomes is the most honest characterisation of this risk — it must be held as an open variable in position sizing decisions. |
| Newcrest Synergy Realisation Update | Q3–Q4 2026 | POSITIVE / MEDIUM-TERM | Progress toward the $500M+ annualised synergy target represents a structural earnings uplift catalyst not fully reflected in current consensus. Each $100M increment of synergy realisation adds approximately $0.08–$0.10 to normalised EPS. |
| 2027 Production Ramp Toward 6M oz Target | H1–H2 2027 | RE-RATING CATALYST | The 2026 production trough (circa 5.5M oz) sets the base for the 2027 volume recovery narrative. If management provides compelling H2 guidance or preliminary 2027 production targets on July 23, this could serve as an early catalyst for the re-rating thesis outlined in our $110 bull case. |
7. Investment Verdict
Synthesis — Bihzuun Research Conclusion
Newmont Corporation presents one of the most structurally compelling large-cap mining investment cases available to institutional allocators — anchored in an unrivalled reserve base, a net cash balance sheet, exceptional margin quality at 32% net profit, and a $6.0 billion buyback programme that functions as a return-of-capital engine independent of gold price direction. The improving margin of safety trajectory across two consecutive Bihzuun screens — 20.9% to 21.3% — confirms that the risk-adjusted opportunity has not deteriorated despite broadly stable spot prices, and the BRS composite score of 4.5 stars reflects genuine, multi-dimensional investment quality that is rare at this market capitalisation tier.
However, the near-term tactical picture demands equal rigour. Three trading days from this report’s publication date, NEM faces a Q2 2026 earnings release that carries above-average miss probability: Q2 production is guided below Q1’s already-weak 1.3 million ounce print, gold prices likely averaged below the company’s own $4,500/oz planning assumption during the quarter, and AISC is expected to rise sequentially before the cycle troughs. The NGM litigation with Barrick adds unquantified legal overhang, and the July 29 FOMC decision creates a compounding macro overlay within a nine-trading-day window of maximum binary density. C-suite transition — a new CEO and interim CFO — means management’s communications credibility is being established in real-time under challenging conditions.
The constructive structural case and the cautious tactical framing are not in contradiction — they define the appropriate response: disciplined accumulation with event-risk awareness. Investors with existing positions are advised to hold with conviction, recognising that short-term earnings volatility does not alter the multi-year thesis. Investors initiating positions should size to permit averaging into weakness if the Q2 earnings print or FOMC decision creates a dislocation toward the $80–$82 support band, where the risk-reward profile improves materially toward the bull case. The $100 central target offers approximately 11.5% upside with 60% confidence; the path to $110 is real but requires sequential execution on AISC improvement, synergy delivery, and gold price stabilisation — a scenario we assign approximately 35% probability over the 12-month horizon.
BRS Rating & BRR Posture
| Rating Dimension | Assessment |
|---|---|
| Bihzuun Research Score (BRS) |
★ ★ ★ |