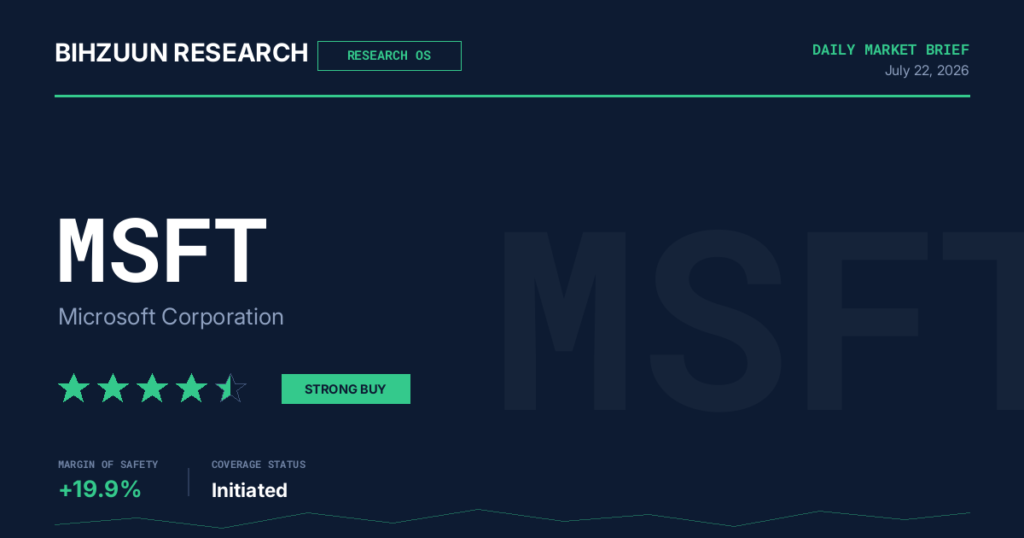
Bihzuun Research — Institutional Equity Report
Microsoft Corporation (NASDAQ: MSFT) | Full Coverage Initiation / Update
1. Summary Scorecard
| Field | Detail |
|---|---|
| Company | Microsoft Corporation |
| Ticker / Exchange | MSFT / NASDAQ |
| Current Price | $397.75 |
| Bihzuun Research Score (BRS) |
★ ★ ★ ★ ★ Strong Buy |
| Bihzuun Research Rating (BRR) | STRONG BUY BRR: Long-Term Accumulate |
| 12-Month Price Target | $440 – $470 (base case) | Bull: $504 | Bear: $451 |
| DCF Intrinsic Value (Base) | $477.00 |
| Implied Margin of Safety vs. DCF | +16.6% upside to DCF base (current price below DCF fair value) |
| Investment Timeframe | 12–36 months (core long-term; near-term catalyst: July 29, 2026) |
| Key Upcoming Catalyst | FY2026 Q4 Earnings & FOMC Decision — July 29, 2026 (7 trading days) |
| Primary Risk | CapEx intensity / FCF compression; Azure growth deceleration below 25% |
2. Business Overview & Economic Moat
Microsoft has executed one of the most consequential platform transformations in technology history — from a legacy software licensor to a vertically integrated cloud, AI, and enterprise productivity platform. The Nadella-era pivot now compounds through three reinforcing layers of AI monetization that no single competitor is currently positioned to fully replicate.
Platform Scale & Installed Base
The foundation of Microsoft’s competitive position is its extraordinary installed base: over one billion Windows installations, approximately 300 million commercial Office seats, deep enterprise integration across GitHub, Teams, Dynamics, and a 90%+ Fortune 500 penetration rate on Microsoft 365 Copilot. This scale is not merely a legacy moat — it is the precise delivery mechanism through which AI monetization is being operationalized. Microsoft embeds AI capabilities directly into workflows enterprises already own and depend upon, dramatically lowering adoption friction relative to greenfield AI alternatives.
Three-Layer AI Monetization Architecture
- Application Layer (Copilot): Paid Copilot seats have exceeded 20 million, and organizations deploying over 50,000 seats have quadrupled — signaling enterprise-scale commitment rather than pilot-stage experimentation. The E7 Frontier Suite, encompassing advanced Copilot capabilities, represents the upper-tier monetization frontier currently being priced into forward estimates.
- Infrastructure Layer (Azure AI Foundry): Azure’s competitive differentiation rests on its support for over 11,000 AI models within a unified infrastructure — enabling enterprises to access multiple AI providers without rebuilding technology stacks. The technical complexity of migrating away from Azure once standardized creates a durable, compounding switching cost that intensifies with every additional workload migrated.
- Enterprise Enablement (Frontier Co.): The third layer targets large-enterprise AI transformation engagements, positioning Microsoft not merely as a vendor but as a co-architect of enterprise AI strategy. This layer directly ties Microsoft’s commercial success to customer AI ROI, embedding the relationship in ways that transactional software licensing never could.
Commercial RPO: Multi-Year Revenue Visibility
Commercial remaining performance obligations surged 99% to $627 billion, with approximately one-quarter expected to convert into revenue over the next twelve months. This backlog represents a level of multi-year revenue visibility that is exceptional even by the standards of enterprise SaaS platforms, and it serves as a structural counterweight to near-term concerns about CapEx intensity — discussed in full in Section 6. The material concentration risk within that backlog — approximately 45% tied to the OpenAI relationship — is a legitimate counterpoint that requires monitoring, as detailed in the risk register.
Moat Assessment
| Moat Source | Strength | Durability Outlook |
|---|---|---|
| Enterprise switching costs (M365, Azure, GitHub) | Very Wide | Deepening — AI integration increases migration complexity |
| AI model diversity on Azure (11,000+ models) | Wide | Strong — architecture-agnostic positioning is defensible |
| Copilot / AI application monetization | Emerging Wide | Building — 20M seats; adoption trajectory is the key variable |
| Custom silicon (Cobalt 100, Maia 200) | Moderate | Growing — cost-per-inference reduction protects margins at scale |
| Network effects (Teams, GitHub developer ecosystem) | Wide | Stable — reinforced by Teams enterprise entrenchment |
3. Financial Deep Dive
Microsoft’s financial profile is, by virtually every quality metric, a fortress. The nuance in this analysis lies not in the income statement — which is unambiguously exceptional — but in the intersection of escalating capital expenditure with free cash flow trajectory, which represents the single most important financial variable in the near-to-medium term.
Core Financial Metrics
| Metric | Value | Bihzuun Commentary |
|---|---|---|
| Revenue (FY2026) | $281.7B | Scale consistent with top-tier global enterprise franchises |
| Net Income | $101.8B | One of the largest absolute net income figures in corporate history |
| Net Margin | 36.1% | Extraordinary for a business of this revenue scale; structurally elevated by software mix |
| Return on Equity (ROE) | 29.6% | Reflects operational efficiency; notably not leverage-inflated |
| Long-Term Debt | $40.2B | Conservative at 10.5% of equity; debt is trivially serviceable at current earnings rates |
| EPS (Diluted) | $13.70 | Dividend payout ratio of ~26% signals strong reinvestment optionality |
| Dividend Yield | 0.90% | Deliberate income under-distribution; capital return via buybacks is the primary shareholder mechanism |
| BRS Growth Score | 100 / 100 | Perfect score; growth trajectory and quality of earnings are pristine |
| BRS Financial Quality Score | 100 / 100 | Highest tier; profitability consistency and margin structure are benchmarks for the sector |
| BRS Balance Sheet Score | 87 / 100 | Strong; minor deduction reflects scale of absolute debt, though immaterial relative to earnings power |
| BRS Valuation Score | 0 / 100 | Reflects significant premium to traditional valuation metrics; discussed in full in Section 4 |
CapEx Intensity & FCF Pressure: The Critical Financial Tension
The dominant financial concern — cross-referenced in the risk register in Section 6 — is the sharp escalation in capital expenditure. Microsoft raised its FY2026 CapEx plan to $190 billion, with $25 billion attributable to hardware cost inflation alone. The consequence has been severe: free cash flow fell 22% year-over-year to $15.8 billion in Q3 FY2026, driven by $31 billion in quarterly CapEx. Barclays projects FCF will slide approximately 28% this year before recovering in FY2027.
Critically, this FCF compression must be interpreted through a capital cycle lens rather than a steady-state profitability lens. The most instructive analog is Microsoft’s own 2014–2016 cloud transition under Satya Nadella — a period of elevated infrastructure investment that preceded a sustained earnings inflection. Whether the current AI infrastructure build follows the same trajectory or represents a more permanent margin reset is the central investment question, and the July 29 earnings call is the most important near-term data point for answering it.
Cloud Margin Profile
Microsoft Cloud gross margin is expected at approximately 64% for Q4 — down year-over-year, primarily driven by AI infrastructure investment and GitHub Copilot scaling costs. This contraction is expected and priced in; the risk lies in further unexpected deterioration rather than the guided step-down itself. Any sequential stabilization or recovery in cloud margin on the July 29 call would be a materially positive signal for the forward earnings trajectory.
4. Multi-Model Valuation Assessment
Intellectual honesty demands that this section acknowledge and directly address the divergence across valuation models, rather than blending incompatible methodologies into a misleading composite. The BRS valuation score of 0/100 reflects genuine premium versus traditional metrics, but the appropriate analytical response is framework selection, not arithmetic averaging.
Valuation Model Outputs
| Model | Output | Structural Fit for MSFT | Bihzuun Weight |
|---|---|---|---|
| DCF (Base Case) | $477.00 | High — captures compounding FCF, growth trajectory, and moat durability | Primary anchor |
| DCF (Bear Case) | $450.76 | High | Downside reference |
| DCF (Bull Case) | $504.33 | High | Upside reference |
| Earnings Power Value (EPV) | $171.25 | Low — zero-growth assumption is structurally unrealistic for MSFT | Stress-test floor only |
| Graham Number | $119.35 | Inapplicable — designed for asset-heavy, value-style businesses; category error for capital-light software | Excluded from composite |
| DDM | N/M (unstable) | Inapplicable — growth rate exceeds discount rate; mathematical instability is itself a signal | Excluded from composite |
| Composite Median (all models) | $216.00 | Misleading — dragged lower by structurally inapplicable models; not a reliable anchor | Disregarded as primary reference |
Current Price vs. DCF Framework
At $397.75, the current price represents a 16.6% discount to the DCF base case of $477.00 — a positive, though not wide, margin of safety. The bear-case DCF of $450.76 also sits above the current price, providing an additional layer of downside support within the DCF framework. This is not an enormous margin of safety — and the financial analysis is explicit that the risk-reward is asymmetric for long-term holders rather than a high-conviction near-term value play. The 12-month price target range of $440–$470 is anchored to continued Azure and Copilot revenue acceleration and represents a moderate-confidence estimate given the CapEx and execution uncertainties ahead.
Valuation vs. Analyst Consensus
The Bihzuun 12-month target of $440–$470 sits meaningfully below the street consensus of approximately $558 (41 Buy ratings, 7 Holds). This conservatism is deliberate — it reflects the CapEx intensity risk, the FCF compression currently in progress, and the macro overlay of a higher-for-longer rate environment. The BRS valuation score of 0/100 is a legitimate caution flag: Microsoft is not cheap on traditional metrics, and investors acquiring at current prices are explicitly paying a premium for durable growth and moat quality that must be continuously earned and demonstrated.
5. Competitive & Industry Analysis
The hyperscaler market has entered a new phase of vertical integration, custom silicon, and AI-native differentiation. Market share percentages increasingly understate the competitive complexity — growth rates, architectural positioning, and monetization layer depth are now the more instructive variables.
Cloud Infrastructure Market Share & Growth Dynamics
| Provider | Est. Market Share | YoY Growth Rate | Bihzuun Competitive Assessment |
|---|---|---|---|
| Amazon Web Services (AWS) | ~30% | +19% | Market share leader; breadth advantage (200+ services); growth rate slowest among Big Three — share erosion risk if AI workload mix shifts |
| Microsoft Azure | ~24% | +40% | Fastest monetization of AI via application-layer integration; 11,000+ model support creates architecture-neutral positioning; management-guided Q4 growth of 39–40% |
| Google Cloud | ~13% | +63% | Fastest absolute growth rate; Gemini leading in long-context and agentic AI tasks; closing share gap at pace that demands close monitoring through 2026–2027 |
Competitive Differentiation: Azure vs. Peers
- vs. AWS: AWS provides infrastructure requiring technical implementation; Azure delivers application-ready AI via Azure AI Foundry — a pre-built orchestration layer connecting 11,000+ models to enterprise applications. Microsoft’s advantage is abstraction and accessibility; AWS’s advantage is breadth and incumbent enterprise relationships at the infrastructure level.
- vs. Google Cloud: Google Gemini is the primary rival in agentic AI and long-context window tasks — an area of genuine competitive risk for Copilot positioning. Google Cloud’s 63% growth rate is the most important competitive signal to monitor; if it sustains, share dynamics will shift materially by late 2027.
- vs. Anthropic (Developer Tools): Anthropic is emerging as a credible threat specifically to GitHub Copilot’s market position in developer tools. This is a focused risk rather than a broad structural threat, but it is worth monitoring given the pace of Anthropic’s enterprise adoption.
Hardware & Silicon Strategy
Microsoft’s expanded AMD partnership for AI infrastructure — alongside its internally developed Cobalt 100 (ARM-based) and Maia 200 (AI accelerator) chips — materially diversifies its dependency on NVIDIA and is expected to lower cost-per-inference at scale. This is a critical margin protection strategy: as Copilot and Azure AI usage scales, unit economics must improve or margins will continue to compress. The custom silicon roadmap is not yet producing margin tailwinds — that inflection is a 2027+ story — but its existence reduces long-term downside risk to the margin recovery thesis.
Ecosystem Interdependencies: AVGO / Micron Read-Throughs
Two adjacent semiconductor events carry read-through relevance for Microsoft’s competitive positioning. First, Broadcom’s VMware pricing pressure continues to accelerate enterprise workload migration to hyperscalers — a dynamic that benefits Azure and AWS approximately equally. Second, Congressional deliberation on the Micron MATCH Act (July 25) and its effect on HBM and DRAM pricing is already embedded in Microsoft’s elevated capex guidance; any supply relief would represent an unmodeled positive to cost assumptions.
6. Risk Mapping
The risk landscape for Microsoft is unusually compressed into a short window — the July 29 earnings and FOMC convergence — against a backdrop of structural CapEx concerns and regulatory escalation. The register below is ordered by assessed materiality to the 12-month thesis.
| Risk Category | Severity | Probability | Description & Thesis Impact |
|---|---|---|---|
| CapEx Intensity / FCF Compression | HIGH | High (in progress) | FY2026 CapEx plan raised to $190B; $25B attributable to hardware cost inflation. FCF fell 22% YoY to $15.8B in Q3. Barclays projects 28% FCF decline for FY2026 before FY2027 recovery. Concentration risk: ~45% of $627B RPO backlog (~$281B) is OpenAI-linked — if that backlog is not solid, the spending rationale weakens materially. This is the primary near-term financial risk and must be addressed in Q4 management commentary. |
| Azure Growth Deceleration | HIGH | Moderate (scenario risk) | The valuation premium is explicitly contingent on Azure sustaining above 30% growth. Below 25%, multiple compression risk becomes severe. Management has guided Q4 at 39–40% — meeting this bar is the single most important print variable. A miss below 37% would materially invalidate the near-term thesis. |
| Regulatory / Antitrust | MEDIUM-HIGH | Medium (ongoing) | FTC expanding antitrust investigation into cloud, software licensing, cybersecurity, and AI. European Commission assessing Teams/Office bundling (Slack complaint). Microsoft’s legal/regulatory risk at 29.6% of total risk profile — well above 20.3% industry average. Unbundling of Teams and pricing revisions offered; Commission determination pending. Financial penalty and forced structural remedies remain tail risks. |
| AI Monetization Execution Lag | MEDIUM | Moderate | The second half of FY2026 is the test of whether AI remains an additive attachment to the Microsoft ecosystem or begins dissolving software margin. Cloud gross margin expected ~64 |