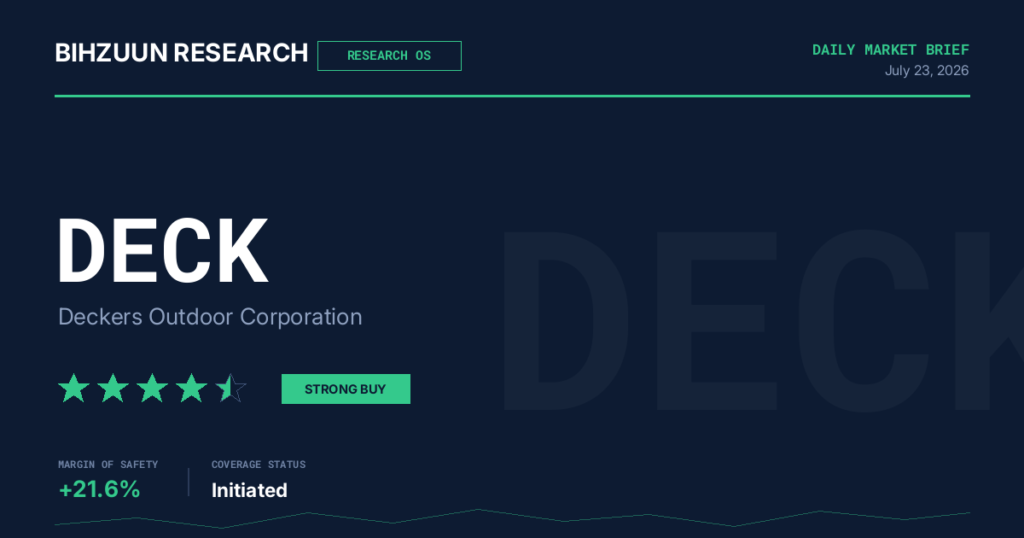
Bihzuun Research — Institutional Equity Report
Deckers Outdoor Corporation (NYSE: DECK) | July 23, 2026
| Attribute | Detail |
|---|---|
| Ticker | DECK — NYSE |
| Sector / Industry | Consumer Discretionary / Footwear & Apparel |
| Bihzuun Research Score (BRS) |
★ ★ ★ ★ ★ Strong Buy |
| Current Price | $102.47 |
| 12-Month Target Price Range | $113 – $119 |
| Base-Case Intrinsic Value Estimate | $112.99 (multi-model composite) |
| Margin of Safety (Base Case) | 10.3% |
| Sensitivity Range | Bear $106.62 | Bull $119.62 |
| Investment Timeframe | 12–18 Months |
| Bihzuun Research Rating (BRR) Posture | LONG — Quality Compounder / Accumulate on Weakness |
| ⚠️ Imminent Catalyst | Q1 FY2027 Earnings — After Market Close TODAY, July 23, 2026 |
1. Business Overview & Economic Moat
Corporate Profile
Deckers Outdoor Corporation is a global designer, marketer, and distributor of premium footwear and apparel, operating through a focused brand portfolio anchored by two globally recognised franchises: UGG and HOKA. The company has deliberately streamlined its portfolio — Koolaburra is being phased out and Sanuk has been divested — sharpening capital and management bandwidth around its two highest-return brand properties. With $5.45 billion in annual revenue, a 18.8% net margin, and zero long-term debt, Deckers represents one of the most financially disciplined operators in the global consumer footwear universe.
Economic Moat Assessment
- Moat Width: Wide (Dual-Pillar Architecture). Deckers’ competitive advantage rests on two structurally distinct brand moats. UGG operates on cultural cachet and emotional brand equity built over decades. HOKA operates on functional performance credibility and an increasingly international distribution footprint. The combination is strategically complementary — UGG stabilises cash flows through lifestyle and gifting cycles while HOKA provides structural growth through the expanding global performance running market.
- Pricing Power — Confirmed. Gross margins hovering near 56% and an operating margin of 23.74% are institutional-grade signals of brand-driven pricing power. For a company selling physical consumer goods through a hybrid DTC and wholesale channel mix, these figures reflect durable price realisation rather than cyclical margin expansion. The consistency of full-price selling — a deliberate management priority — underpins the gross margin floor.
- HOKA: Multi-Franchise Brand Architecture. By fiscal year-end 2026, six HOKA product families individually surpassed $100 million in annual revenue, with three additional families approaching that threshold. This architecture is a critical moat signal: HOKA is no longer dependent on any single silhouette (e.g., the Clifton or Bondi alone), which would be structurally fragile. A diversified revenue base across product families reduces the style-cycle risk that has historically destabilised single-franchise footwear brands. HOKA’s #1 position at Fleet Feet — the bellwether U.S. specialty running retailer — further entrenches its performance credibility among core running consumers, who are the highest-advocacy segment in the category.
- UGG: Shallower, Trend-Dependent Moat. UGG’s moat is genuine but narrower and more maintenance-intensive. The brand competes in lifestyle and fashion-adjacent footwear where trend cycles are shorter and consumer loyalty is more conditional. Management has navigated this through product refreshes, UGG’s recognisable aesthetic, and category extensions — but the structural imperative to continuously generate cultural relevance is a differentiated risk versus HOKA’s more functionally anchored positioning.
- Balance Sheet as Strategic Optionality. Ending FY2026 with $1.9 billion in cash and no outstanding borrowings, Deckers’ fortress balance sheet functions as a moat extender: it provides the financial runway to invest aggressively through downturns, pursue opportunistic M&A, and execute against its $5 billion share repurchase authorisation — all without capital market dependency. This balance sheet strength directly reinforces brand durability by insulating Deckers from the forced discounting and channel-stuffing decisions that weaker-capitalised competitors must make in downturns.
2. Financial Deep Dive
Income Statement Quality
| Metric | Value | Bihzuun Commentary |
|---|---|---|
| Revenue | $5,454M | Mid-to-high single digit CAGR target through FY2030 |
| Net Income | $1,024M | Consistent with genuine earnings power, not accounting artefact |
| Net Profit Margin | 18.8% | Elite for consumer footwear; reflects brand pricing power |
| Operating Margin (FY2026) | 23.74% | Best-in-class; FY2027 guided lower at ~21.5% on tariff headwinds |
| Gross Margin (FY2026) | ~56% | FY2027 guided at 56.5%; freight and input cost pressure partially offset |
| Reported EPS | $7.04 | FY2027 guidance: $7.30–$7.45; implies low double-digit EPS CAGR trajectory |
| Return on Equity | 41.0% | Elite across virtually all sector benchmarks; capital-efficient model confirmed |
| Dividend Yield / Payout | 0.0% / 0.0% | Growth-reinvestment philosophy; buyback-oriented capital return |
The 18.8% net margin is a structurally important data point: for a consumer goods company operating in physical retail, wholesale, and DTC channels simultaneously, this is an exceptional level of retained earnings generation. The 41% ROE, particularly meaningful in the context of a zero-debt capital structure, confirms that returns are driven by operational and brand leverage — not financial engineering. Cross-referencing with the valuation section, this ROE level is precisely what supports a mid-teens earnings multiple despite limited near-term deep-value characteristics.
Balance Sheet Integrity
| Metric | Value | Bihzuun Commentary |
|---|---|---|
| Long-Term Debt | $0 | Zero financial leverage; no debt servicing obligations |
| Long-Term Debt Ratio | 0.0% | Perfect Balance Sheet score in BRS framework |
| Shareholders’ Equity | $2,500M | Asset-light model; high ROE relative to book |
| Cash & Equivalents (FY2026 end) | ~$1,900M | Substantial liquidity buffer; no external financing required |
| Share Repurchase Authorization | $5,000M total | Meaningful capital return floor; structural support for EPS trajectory |
The inventory build noted in competitive risk monitoring warrants ongoing surveillance. A sharp recent increase in inventory levels can be an early-warning signal of demand weakness or channel mis-calibration — and in a brand premium context, excess inventory that reaches discount channels can impair brand equity durably. Management’s stated commitment to full-price selling discipline makes an inventory liquidation scenario via discounting unlikely in the near term, but this metric should be tracked against revenue trends at the Q1 FY2027 print tonight.
BRS Scorecard Composite
| Criterion | Score | Assessment |
|---|---|---|
| Financial Quality | 100 / 100 | Best-in-class margins, ROE, and earnings consistency |
| Balance Sheet | 100 / 100 | Zero debt, substantial cash; fortress structure |
| Growth | 100 / 100 | Multi-year revenue and EPS CAGR targets; HOKA global expansion |
| Valuation | 34 / 100 | Not deeply discounted; modest but real margin of safety at current price |
| Income | 15 / 100 | Zero dividend yield; buyback-only capital return framework |
| Composite | 74.1 / 100 | Strong overall; penalised by yield absence and current valuation proximity to intrinsic value |
The 74.1 composite score is internally consistent and should be interpreted correctly: the low Income and Valuation subscores are not warning signals — they reflect that Deckers is a zero-yield growth compounder trading near fair value rather than at a distressed discount. The three perfect subscores confirm that the underlying business is operating at institutional-quality standards. For yield-oriented investors, the low Income score is a structural mismatch; for growth and quality-oriented investors with a 12–18 month horizon, the composite strongly supports the Strong Buy posture.
3. Multi-Model Valuation Assessment
Intrinsic Value Model Summary
| Valuation Model | Estimated Value | Applicability / Notes |
|---|---|---|
| DCF — Declining Growth | $112.99 | Base-case composite anchor; assumes mid-single-digit terminal growth |
| Comparable Transactions | $118.99 | Upper-range anchor; reflects premium brand M&A multiples |
| Earnings Power Value (EPV) | $88.00 | Conservative floor; strips growth premium; useful downside anchor |
| Dividend Discount Model (DDM) | N/A | Inapplicable — zero dividend policy |
| Graham Number | N/A | Inapplicable — asset-light model; book value inadequate anchor |
| Multi-Model Composite | $112.99 | 10.3% margin of safety vs. current price of $102.47 |
Sensitivity Analysis
| Scenario | Implied Value | Key Assumption |
|---|---|---|
| Bear Case | $106.62 | Margin compression, HOKA growth stall, macro headwind |
| Base Case | $112.99 | Mid-to-high single digit revenue growth; stable margins |
| Bull Case | $119.62 | Beat-and-raise cycle; tariff mitigation exceeds expectations; multiple expansion |
The relatively tight dispersion between bear and bull case estimates ($106.62 to $119.62) reflects strong confidence in the fundamental earnings model, even under stressed assumptions. The bear case sits only ~4% below current price — meaning the downside is notably limited in a fundamental scenario absent a macro or company-specific shock. This asymmetry (limited downside, 10–17% upside to composite/bull range) is precisely what defines a high-quality compounder entry point, and is a cross-reference reinforcement of the Strong Buy rating notwithstanding the modest margin of safety in isolation.
The EPV floor at $88.00 — while appearing more distant — is an important stress-test anchor. It implies that even if one strips Deckers’ growth premium entirely and values the business solely on normalised static earnings power, the current market price embeds only a modest, finite growth premium. This is a sign of reasonable multiple discipline in the market’s current pricing.
The 12-month price target range of $113–$119 is defended at moderate-to-high confidence, contingent on continued mid-to-high single-digit revenue growth, gross margins holding near the 56.5% guided level, and successful tariff cost pass-through. A beat-and-raise tonight could compress the timeline for this re-rating meaningfully.
4. Competitive & Industry Analysis
Competitive Landscape Mapping
| Competitor | Primary Overlap | Threat Level | Key Dynamic |
|---|---|---|---|
| On Running (ONON) | HOKA — Aspirational/Lifestyle Running | High | Revenue scaled from $832M (2022) to ~$3.2B (2025); 285% growth in 3 years; aggressive lifestyle crossover |
| Brooks Running | HOKA — Functional/Specialty Running | Moderate | Core specialty channel competitor; HOKA currently holds #1 position at Fleet Feet |
| Asics | HOKA — Functional Running | Moderate | Technically credible; growing international footprint; less lifestyle presence |
| New Balance | HOKA — Lifestyle-Performance Crossover | Moderate | Strong heritage revival; credible both on performance and fashion channels |
| Nike (NKE) | Both HOKA and UGG (broad-field) | Moderate–High | Spans entire field; currently in strategic transition; DTC restructuring ongoing |
| Generic Fashion Footwear | UGG — Lifestyle | Low–Moderate | UGG’s brand premium insulates from lower-price competition; trend risk is primary concern |
Competitive Positioning Commentary
- HOKA vs. On Running — The Central Competitive Dynamic. The competitive threat from On Running deserves the most institutional attention of any single factor in the DECK competitive landscape. On’s 285% revenue growth between 2022 and 2025 represents one of the most dramatic market-share accumulation stories in global athletic footwear in a decade. The overlap with HOKA is highest on the aspirational and lifestyle-crossover side — precisely where HOKA has deliberately avoided competing in order to protect its performance running credibility. That strategic discipline is the right long-term call for moat preservation, but it does cap HOKA’s total addressable market in the near term relative to a brand like On that is willing to span performance and fashion simultaneously. HOKA’s growth deceleration — from 28% net sales growth two years prior, to 24% one year prior, to 15.9% in FY2026 — is consistent with this dynamic and should be monitored as a leading indicator of competitive pressure rather than solely demand saturation.
- HOKA’s Specialty Channel Dominance as Moat Signal. The #1 and #2 ranked shoes at Fleet Feet (Clifton and Bondi, respectively) represent a defensible moat position in the highest-advocacy distribution channel in U.S. running. Specialty running consumers — who buy multiple pairs annually, influence peer recommendations, and have above-average income — are the most valuable segment in the category. HOKA’s leadership here is not easily replicated, and reflects genuine product and brand credibility that advertising spend alone cannot manufacture.
- International Expansion as a Long-Duration Growth Driver. HOKA’s emergence as a top-three performance running brand in France, Italy, and the UK, combined with premium full-price positioning in China, signals that the international growth runway remains materially underpenetrated. At 15.9% net sales growth in FY2026 with significant geographic white space remaining, the medium-term growth thesis is not dependent on recapturing U.S. domestic growth rates.
5. Risk Mapping
Risk Register
| Risk Category | Risk Factor | Severity | Probability | Mitigation / Management Response |
|---|---|---|---|---|
| Supply Chain / Trade Policy | Vietnam tariff exposure: potential $150M–$200M COGS increase annually | High | Medium | Price increases + supplier cost-sharing agreements; partial offset in FY2027 guidance (56.5% GM) |
| Brand Concentration | Two-brand portfolio; UGG fatigue or HOKA U.S. stall without a third material brand | High | Low–Medium | HOKA multi-product family diversification; UGG product refreshes; $1.9B cash for M&A optionality |
| Competitive Intensity | On Running encroaching on HOKA aspirational consumer; Nike restructuring and potential re-engagement | High | Medium–High | HOKA channel discipline; specialty retail moat; international expansion as growth diversifier |
| HOKA Growth Deceleration | Net sales growth rate declining (28% → 24% → 15.9%); risk of continued deceleration | Medium–High | Medium | New product family launches; international geographic expansion; AI/digital investment |
| Inventory Build | Sharp recent increase in inventory levels; risk of discounting or channel pressure | Medium | Low–Medium | Full-price selling discipline; DTC channel management; inventory data to be updated tonight |
| Macroeconomic / Consumer | Premium footwear ($150+) disproportionately exposed to consumer spending slowdown; weak June NFP (+57K) | Medium–High | Medium | Brand resilience in prior cycles; UGG gifting demand partially counter-cyclical; balance sheet strength |
| Monetary Policy (FOMC) | Fed funds at 3.50–3.75%; June dot plot signals potential hike; hawkish surprise would pressure consumer discretionary multiples | Medium | Low–Medium | Rate sensitivity is a sector-wide, not company-specific, risk; quality premium historically compresses less |
| Currency / FX Exposure | Growing international revenue base increases FX translation risk (EUR, GBP, CNY) | Low–Medium | Medium | Natural hedging through international cost base; financial hedging instruments |
| Valuation / Earnings Miss | Stock not trading at deep discount; EPS miss could compress multiple meaningfully | Medium | Low–Medium | Limited downside to bear-case intrinsic value ($106.62); buyback authorisation provides floor support |
6. Catalyst Monitor
⚠️ Imminent: Q1 FY2027 Earnings — Tonight, July 23, 2026 (After Market Close)
| Watch Item | Consensus / Guidance | Beat Threshold | Bihzuun Read-Through |
|---|---|---|---|
| EPS (Q1 FY2027) | $0.87 (18-analyst consensus; drifted -6.5% over 90 days, recently stabilised) | ≥ $0.93 (prior 90-day estimate) | Prior quarter beat: $0.96 actual vs. $0.81 consensus (+$0.15). High-quality bar set. |
| Revenue (Q1 FY2027) | $1.02B consensus | ≥ $1.05B for meaningful positive signal | HOKA guided to low-double-digit growth; UGG guided to mid-single-digit growth YoY |
| Gross Margin | ~56.5% (full-year guidance) | ≥ 56.5% confirms tariff pass-through success | Any upward revision to GM guidance would be a strong positive re-rating trigger |
| HOKA Domestic vs. International Revenue Split | Not separately guided | International acceleration confirms geographic diversification thesis | Critical for assessing U.S. competitive pressure from On Running |
| Tariff Mitigation Language | $150M–$200M COGS headwind partially offset by price + supplier cost-sharing | Credible Q2 and FY2027 offset framework | Management tone here may be the single most important factor for multiple re-rating |
| FY2027 Guidance Revision | Current EPS guide: $7.30–$7.45 | Raise: ≥ $7.50+ / Cut: ≤ $7.20 would be negative | A guide-down in a potentially hawkish FOMC week would be significantly punished |
| Inventory Levels | Elevated vs. prior period; watch for normalisation | Flat or declining inventory growth vs. revenue growth | Inventory-to-sales ratio is a leading indicator of potential discounting pressure |
Near-Term Macro Catalyst Calendar
| Date | Event | Relevance to DECK |
|---|---|---|
| July 23, 2026 (Tonight) | ⚠️ DECK Q1 FY2027 Earnings | Primary binary event; all watch items above apply |
| July 29, 2026 | FOMC Decision (2-day meeting conclusion) | Rate held at 3.50–3.75% for four meetings; hawkish surprise pressures consumer discretionary multiples broadly |
| July 30, 2026 | Q2 GDP Advance Estimate | Key macro read-through for premium consumer spending demand; consumer discretionary sentiment setter |
| August 7, 2026 | July Nonfarm Payrolls | Following a weak June print of +57K; a second consecutive weak print would pressure consumer discretionary re-rating |
Medium-to-Long Term Catalysts
- Jefferies Upgrade to Buy — Citing HOKA innovation pipeline and resilient UGG strength as medium-term upside drivers; noted that recent stock weakness despite a double FQ4 beat creates a favourable risk/reward entry.
- FY2030 Multi-Year Framework — Deckers targets a high single-digit revenue CAGR and low double-digit EPS CAGR through FY2030, supported by AI and digital initiative investment. This framework, if confirmed with credible interim progress milestones, supports a sustained multiple expansion narrative for quality-oriented institutional allocators.
- HOKA International White Space — Top-three brand position in France, Italy, and the UK established; China premium positioning in early innings. Geographic diversification of brand revenue reduces U.S. macro and competitive concentration risk over time.
- Share Repurchase Execution — The $5 billion total authorisation provides structural EPS accretion tailwind and signals management confidence in intrinsic value at or below current price levels, consistent with the BRS base-case estimate.