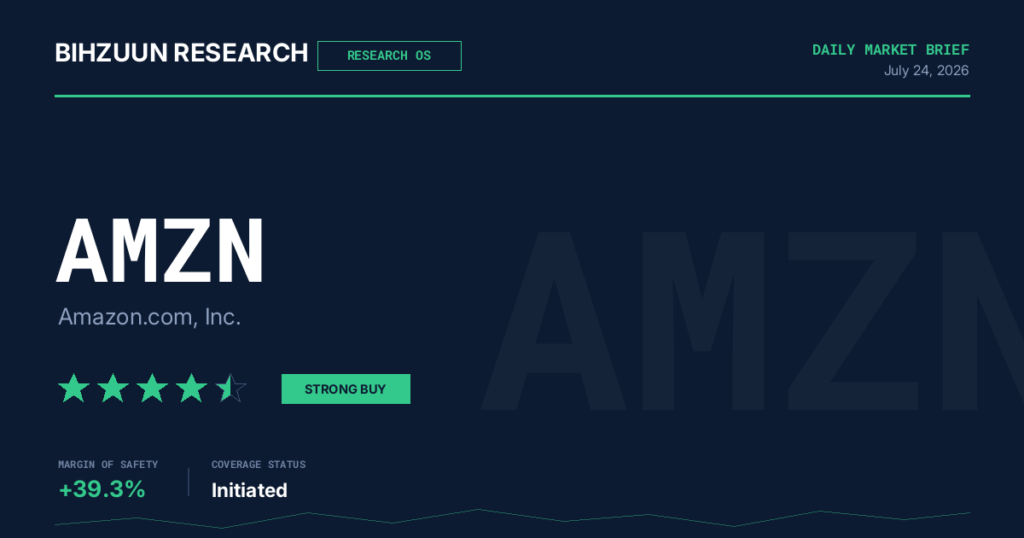
AMAZON.COM, INC. | AMZN
NASDAQ · Consumer Discretionary / Cloud Infrastructure / Digital Advertising
1. Summary Scorecard
| Field | Detail |
|---|---|
| Ticker / Exchange | AMZN / NASDAQ |
| Bihzuun Research Score (BRS) |
★ ★ ★ ★ ★ Strong Buy |
| Bihzuun Research Rating (BRR) | STRONG BUY — Thesis-Driven, Event-Calibrated |
| Current Price | $233.66 |
| Central Fair Value Estimate | $215.00 |
| 18-Month Fair Value Range | $195 – $250 |
| Optimal Accumulation Zone | $195 – $205 (material margin-of-safety improvement) |
| Margin of Safety vs. Composite Median | −15.4% (stock trading above composite fair value of $197.77) |
| Conviction Level | Moderate-High (~55% confidence at current price; rises materially on pullback to $195–$205) |
| Investment Timeframe | 18 Months Primary; 36 Months Thesis Horizon |
| ⚠ Imminent Catalyst | Q2 2026 Earnings — July 30, 2026 1 TRADING DAY |
| Key Scorecard Dimensions |
Growth: 100 Financial Quality: 76 Balance Sheet: 83 Valuation: 0 Income: 15 |
2. Business Overview & Economic Moat
Corporate Architecture
Amazon.com, Inc. is the largest integrated digital commerce and cloud infrastructure platform in the world, operating across three principal economic engines: (1) a retail and logistics ecosystem encompassing first-party e-commerce, third-party marketplace services, and the Prime loyalty flywheel; (2) Amazon Web Services (AWS), a hyperscale cloud platform commanding approximately 30% global cloud infrastructure market share; and (3) a rapidly maturing advertising segment generating over $70 billion in trailing twelve-month revenue. These three engines do not operate in isolation — their structural interdependence is precisely what makes Amazon’s competitive position so resistant to single-vector attack. AWS profits subsidise logistics density; Prime loyalty generates the purchase-intent data that powers advertising yield; advertising revenue, in turn, funds incremental fulfilment capacity. No single competitor possesses this architecture in its entirety.
Moat Width and Structural Sources
Bihzuun Research assesses Amazon’s economic moat as Wide and Durable, operating across at least four self-reinforcing dimensions simultaneously:
- E-Commerce Network Dominance: Amazon controls approximately 40% of U.S. e-commerce sales versus Walmart at 6–7% and Target near 2%. The gap is not merely quantitative — it is structural. Amazon’s third-party seller network creates a marketplace liquidity advantage that self-compounds as seller count grows, improving selection, driving Prime adoption, and deepening fulfilment economics.
- Cloud Infrastructure Lock-In: AWS sits at a $150 billion annualised revenue run rate with AI-related revenue now exceeding $15 billion. The stickiness of cloud workloads — driven by proprietary toolchains, data gravity, and migration costs — creates a switching-cost moat that is among the most durable in enterprise technology. The $364 billion pre-committed AI services backlog provides a contractually anchored multi-year revenue visibility floor that most growth equities cannot offer.
- Custom Silicon Differentiation: Amazon’s Trainium and Graviton chip programmes, now running at over $20 billion annually, are creating a hardware-layer moat that reduces unit economics dependency on third-party chip supply and provides AWS customers with price-performance advantages unavailable on competing platforms. The Trainium capacity commitments from OpenAI (~2 GW beginning 2027) and Anthropic (up to 5 GW) represent contracted anchor demand that structurally validates this investment thesis.
- Advertising Purchase-Intent Advantage: Amazon’s advertising platform possesses a structural edge over Meta and Google in conversion-oriented spend because its signals are generated at the point of purchase decision, not at browsing or social engagement. This positions Amazon as the highest-ROI channel for bottom-funnel retail advertisers, creating a monetisation wedge that grows proportionally with Prime membership density.
The moat’s durability is further reinforced by the bundling architecture itself: the combination of AWS profits, advertising margin, and Prime loyalty within a single corporate ecosystem creates a cross-subsidisation engine that no single-vertical competitor can replicate. Walmart can match logistics. Microsoft can match cloud. Meta can match advertising. None can match all three simultaneously.
3. Financial Deep Dive
Income Statement Quality
| Metric | Value | Assessment |
|---|---|---|
| Revenue (TTM) | $716.9 billion | Strong |
| Net Income (TTM) | $77.7 billion | Strong |
| Net Margin | 10.8% | Meaningful Expansion vs. History |
| EPS | $7.29 | Monetisation of Infrastructure Cycle |
| Return on Equity | 18.9% | Respectable at Scale |
| Growth Scorecard | 100 / 100 | Maximum |
| Financial Quality Scorecard | 76 / 100 | Solid |
| Income Scorecard | 15 / 100 | Unsuitable for Yield Mandates |
Amazon’s 10.8% net margin represents a qualitative inflection point in the company’s earnings history. For most of its publicly traded life, Amazon operated at margins that prioritised scale over profitability, reinvesting every incremental dollar into logistics, data centres, and new category expansion. The current margin profile reflects the structural maturation of AWS and advertising as high-margin businesses large enough to lift the consolidated P&L above the gravitational pull of thin-margin retail operations. EPS of $7.29 is the clearest financial expression of this maturation. The perfect Growth scorecard score of 100 corroborates that this profitability improvement is not a one-period anomaly — it reflects sustained positive revisions to forward expectations across multiple dimensions.
Balance Sheet & Capital Structure
| Metric | Value | Assessment |
|---|---|---|
| Total Equity | $411.1 billion | Substantial |
| Long-Term Debt (Legacy) | $65.6 billion | Conservative Ratio |
| LT Debt / Equity | 13.8% | Low Leverage |
| Long-Term Debt (Current, Post-Capex Surge) | $119.1 billion | Elevated; Monitor Trajectory |
| Interest Expense (Current) | $800 million | Rising from $541M; Rate-Sensitive |
| Balance Sheet Scorecard | 83 / 100 | Strong |
| Dividend / Payout Ratio | None / 0% | Reinvestment Philosophy; Not Yield-Eligible |
Free Cash Flow & Capital Expenditure: The Critical Tension
The most important single financial data point in this report is the free cash flow trough. Amazon’s trailing twelve-month free cash flow has compressed dramatically from $26 billion to approximately $1.2 billion, driven by a $59.3 billion surge in AI-related property, plant, and equipment purchases. Q1 2026 capital expenditure reached a record $44.2 billion, up over 76% year-over-year, with full-year 2026 guidance pointing toward approximately $200 billion. This is the defining financial tension in the Amazon investment thesis: the company is funding the largest capital deployment in its history on the conviction that AI infrastructure demand will monetise at scale. Long-term debt rising to $119.1 billion — nearly double the figure cited in the legacy balance sheet data — reflects the debt financing component of this buildout. Investors must hold two truths simultaneously: the balance sheet remains manageable given the equity base, and the FCF trough creates meaningful short-to-medium-term vulnerability to a rate environment that is not accommodating of duration-heavy growth stories. The resolution of this tension — in either direction — is the central valuation variable for the 18-month horizon.
4. Multi-Model Valuation Assessment
| Valuation Model | Estimate | Methodology Note | Weight in Composite |
|---|---|---|---|
| DCF — Base Case (Declining) | $311.65 | Growth-weighted; most optimistic; sensitive to terminal rate assumptions | Indicative; not primary anchor |
| DCF — Bear Case | $295.11 | Still substantially above current price; reflects heavy cash flow weighting | Indicative; not primary anchor |
| Comparable Company Analysis | $197.77 | Market-grounded; most reflective of current peer multiples | Primary anchor |
| Graham Number | $79.55 | Most conservative; EPS $7.29 vs. large book value; not applicable as standalone | Floor reference only |
| Composite Median Fair Value | $197.77 | Blended model output | Primary reference |
| Bihzuun Central Estimate (18-Month) | $215.00 | Adjusted for AWS growth optionality and AI infrastructure monetisation | Analyst target |
The valuation picture warrants institutional-grade nuance. The composite median fair value of $197.77 places current pricing at a negative margin of safety of 15.4% — a genuine quantitative caution flag that fully justifies the Valuation scorecard score of 0. At $233.66, investors are paying a premium that can only be rationalised by forward-looking assumptions about AWS AI monetisation, advertising margin expansion, and logistics operating leverage, none of which are guaranteed. This does not make the stock uninvestable — it makes it price-sensitive.
The DCF models present a counterintuitive finding: even the bear case at $295.11 sits well above current price. This is not a validation of current pricing — it is a methodological artefact of a growth-weighted, long-duration DCF applied to a company with Amazon’s expected cash flow trajectory. When the FCF trough is as pronounced as $1.2 billion TTM, forward-model outputs become highly sensitive to discount rate assumptions, and a 50 basis point hawkish surprise from the FOMC can mechanically widen the gap between DCF output and market price. Investors relying on DCF analysis alone to underwrite the current price are exposed to model risk.
The Comparable Company analysis at $197.77 is the most market-grounded anchor precisely because it reflects what rational buyers are paying for comparable earnings streams across the current rate regime. Bihzuun’s central 18-month estimate of $215.00 acknowledges the comparable analysis as the floor of reasonableness while incorporating a premium for the AWS AI backlog optionality and contracted Trainium demand. The optimal accumulation zone of $195–$205 represents the price range at which the margin of safety materially improves and the risk-reward tilts more decisively in the investor’s favour.
5. Competitive & Industry Analysis
Cloud Infrastructure: The Three-Hyperscaler Race
| Provider | Q1 2026 Market Share | Primary Competitive Edge | Key Threat to AWS |
|---|---|---|---|
| AWS (Amazon) | ~30% | Broadest service portfolio; custom silicon; AI backlog; enterprise relationships | Azure OpenAI integration; DMA gatekeeper designation risk |
| Microsoft Azure | ~24% | Enterprise Microsoft stack integration; OpenAI partnership depth | Narrowing gap with AWS; also faces DMA gatekeeper designation |
| Google Cloud | ~13–14% | Big data analytics; specialised AI/ML tooling; competitive pricing | Third-place market share dynamic; enterprise trust gap |
Cloud infrastructure revenues are on track to exceed $500 billion industry-wide for the first time in 2026, validating the scale of the AI-driven demand wave all three hyperscalers are positioning for. The critical competitive risk for AWS is not erosion of existing market share — churn rates on mature cloud workloads remain structurally low — but rather the composition of net new AI workload wins. Microsoft Azure’s deep integration of OpenAI capabilities across the enterprise stack (M365, Dynamics, GitHub Copilot) creates a powerful bundling dynamic that may divert incremental AI spend from AWS in segments where Microsoft has pre-existing relationships. The AWS counter-thesis is the Anthropic and OpenAI Trainium commitments themselves: the decision by two of the world’s most prominent AI labs to build on AWS custom silicon is the strongest available market signal that the platform is technically competitive at the frontier.
E-Commerce: Retail Competitive Dynamics
Walmart has emerged as the most credible domestic e-commerce challenger, with its U.S. online segment growing 24% year-over-year and share approaching 7%. Walmart’s structural advantage — 4,700 U.S. stores functioning as distributed fulfilment hubs — enables same-day delivery economics that Amazon must replicate through purpose-built logistics infrastructure at considerably higher capital cost. This is a genuine competitive development, not a trivial one. However, the gap from 7% to 40% share is structural, not cyclical, and closing it would require a generational shift in consumer behaviour that has not materialised despite years of Walmart investment. Internationally, Temu (PDD Holdings) and Alibaba apply price-based pressure, particularly in emerging markets, but Amazon’s international segments remain structurally differentiated on selection, delivery speed, and Prime loyalty monetisation.
Advertising: Structural Differentiation
At over $70 billion in TTM revenue, Amazon’s advertising business is now a top-five global digital advertising platform. Its structural differentiation versus Meta and Google lies in purchase-intent signal quality: Amazon’s data is generated at the moment of commercial decision, not during content consumption or social browsing. This makes Amazon’s inventory uniquely valuable for bottom-funnel, conversion-oriented advertisers, and explains why advertising revenue growth has remained resilient even as broader digital advertising markets have experienced cyclical volatility. The risk, crossreferenced with the macro section below, is that advertising is the most cyclically sensitive of Amazon’s three primary revenue streams — a meaningful GDP deceleration would pressure advertiser budgets disproportionately relative to AWS contracts or Prime subscriptions.
6. Risk Mapping
| Risk Factor | Severity | Probability | Time Horizon | Mitigation / Monitor |
|---|---|---|---|---|
| FCF Trough & Capex Overrun | High | Active / Confirmed | Near-term (0–12 months) | Monitor Q2 FCF trajectory; Q3 capex guidance on July 30 |
| Interest Rate Sensitivity (Duration Risk) | High | Moderate | Near-to-medium-term | 10-year at 4.71%; FOMC decision July 29; dot plot trajectory |
| AWS Growth Deceleration (below 25%) | High | Low-Moderate | Near-term catalyst (July 30) | Key binary: ≥33% = strong positive; <25% = material downside trigger |
| EU Digital Markets Act — Cloud Gatekeeper Designation | Medium | Elevated | Medium-term (Sept–Oct 2026) | Written representations due Sept 2026; EC final decision ~Oct 2026; fines up to 10% global turnover if non-compliant |
| U.S. FTC Antitrust Bench Trial | Medium | Moderate | Medium-to-long-term (trial Feb 9, 2027) | Pre-trial discovery active; headline risk ongoing; structural remedy risk in long tail |
| AI Monetisation Lag (Capex Thesis Invalidation) | High | Low | Medium-term (12–24 months) | Contractual backlog ($364B) provides buffer; monitor AI revenue growth rate quarterly |
| Macro Recession / Advertising Revenue Contraction | Medium | Moderate | Near-to-medium-term | BEA Q2 GDP release July 30; advertising is most cyclical segment |
| Microsoft Azure Share Gains in Enterprise AI | Medium | Moderate / |