Bihzuun Research — Institutional Equity Report
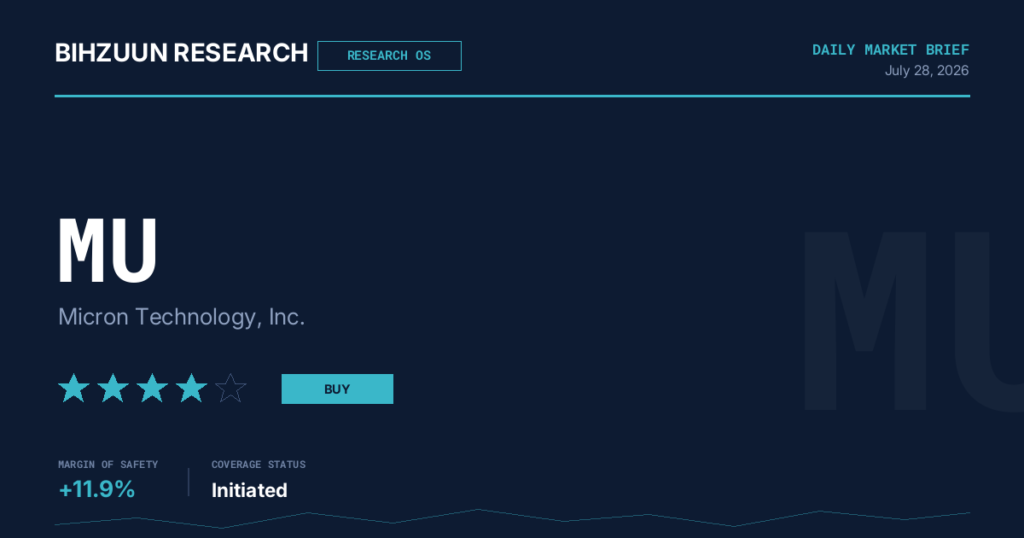
Micron Technology, Inc. (NASDAQ: MU) | July 28, 2026
| Field | Detail |
|---|---|
| Ticker | MU (NASDAQ) |
| Sector / Industry | Technology — Semiconductor Memory |
| Current Market Price | $900.20 |
| BRS Composite Fair Value (Fundamental Median) | $114.75 |
| Margin of Safety (Current) | −87.2% (5-screen trend: 11.9% → 11.9% → 11.9% → 11.8% → 11.9%) |
| Analyst Fundamental Target (12–18 Month Normalized) | $100 – $135 |
| BRS Star Rating |
★ ★ ★ ★ ★ Buy |
| Bihzuun Research Rating (BRR) | Momentum-Driven Buy | Fundamental Caution Flagged |
| Coverage Continuity | 5 consecutive screens passed since 2026-07-16 |
| Imminent Risk Flag | ⚠ FOMC Decision — July 29, 2026 (Tomorrow) |
| Report Date | July 28, 2026 |
1. Business Overview & Economic Moat
Corporate Profile
Micron Technology is one of three global participants in the DRAM and NAND flash oligopoly, and the sole U.S.-headquartered producer of high-bandwidth memory (HBM) — the critical interface layer between AI accelerators and compute workloads. Headquartered in Boise, Idaho, Micron operates advanced fabrication facilities across the United States, Taiwan, Japan, and Singapore, and has committed to a multi-year domestic capacity expansion underpinned in part by federal semiconductor manufacturing incentives.
Moat Assessment
| Moat Dimension | Assessment | Durability |
|---|---|---|
| U.S.-Only HBM Production | Structural customer-retention advantage as hyperscalers domesticate AI supply chains; eligible for federal incentives unavailable to foreign peers | High |
| Technology Leadership (1-gamma DRAM / EUV) | Quarterly R&D expenditure exceeding $1.25 billion sustains process node competition; HBM4 mass production commenced ahead of schedule | Moderate–High |
| Demand Visibility / Contracted Supply | Full 2026 HBM4 allocation sold out under multi-year Strategic Customer Agreements; management cites materially enhanced earnings predictability | Moderate (cycle-dependent) |
| Scale & Capital Density Barrier | ~$27 billion FY2026 capex program creates meaningful entry deterrence; coupled with process complexity, new entrants face multi-year lead-time disadvantage | Moderate |
| Commodity DRAM/NAND (Standard) | Price-taking dynamic persists; moat is narrow and subject to rapid supply-cycle erosion | Narrow / Cyclical |
The critical institutional framing is this: Micron’s moat has structurally widened in this cycle, but the widening is concentrated in HBM rather than across the legacy memory book. The HBM segment’s contribution to total revenue remains a fraction of the whole, meaning the broader commodity exposure persists as the primary earnings driver near-term. As HBM’s revenue share scales — management is targeting 25% of the total HBM market — the quality of the moat improves commensurately. That transition is under way but incomplete.
2. Financial Deep Dive
Income Statement & Profitability
| Metric | Value | Commentary |
|---|---|---|
| Revenue (TTM) | $37.4B | Accelerating; FQ3 2026 alone delivered $41.46B annualised run-rate |
| Net Income (TTM) | $8.5B | Cyclical recovery from deep losses in FY2023; trajectory sharply positive |
| Net Margin | 22.8% | Reflects pricing power recovery; Q4 FY2026 GAAP gross margin guided at ~86%, implying margin expansion is ongoing and has not yet peaked in reported figures |
| Return on Equity | 15.8% | Respectable for capital-intensive manufacturing; not exceptional relative to cost of capital in normalized conditions — cross-references to valuation concern in Section 4 |
| BRS Growth Score | 100 / 100 | Maximum score; however, semiconductor growth metrics are cycle-peak sensitive and inherently mean-reverting |
| BRS Financial Quality Score | 63 / 100 | Solid; capital intensity and FCF conversion drag prevent a higher reading |
| BRS Income Score | 2 / 100 | Dividend yield 0.06%; payout ratio 6.9% — capital is directed entirely toward fab reinvestment |
Balance Sheet & Capital Structure
| Metric | Value | Commentary |
|---|---|---|
| Shareholders’ Equity | $54.2B | Substantial book base; supports Graham Number anchor in valuation |
| Long-Term Debt | $14.0B | LT Debt Ratio of 20.6%; comfortable given $8.5B annual net income |
| BRS Balance Sheet Score | 74 / 100 | Sound but not pristine; ongoing capex obligations ($27B FY2026) structurally constrain free cash flow conversion |
| FY2026 Capex Guidance | ~$27B | Accelerating further in FY2027; necessary for competitive positioning but simultaneously seeds future supply overhang risk (see Risk Mapping, Section 6) |
| BRS Valuation Score | 0 / 100 | Unambiguous signal; current market price structurally disconnected from normalized fundamental anchors |
Forward Guidance (FQ4 2026)
- Revenue guidance: $50B ± $1B — materially ahead of prior consensus
- GAAP Gross Margin guidance: ~86% — exceptional by any semiconductor standard
- GAAP EPS guidance: $30.73 ± $1.00
- Data center revenue in FQ3 2026 grew more than sevenfold year-over-year to $11.5B; this single segment’s trajectory is the primary justification for the DCF premium embedded in the market price
3. Multi-Model Valuation Assessment
Intrinsic Value Model Summary
| Model | Implied Value | Interpretive Weight |
|---|---|---|
| Graham Number | $91.39 | Normalized earnings-power floor; most conservative; appropriate for cycle-trough scenario |
| Earnings Power Value (EPV) | $95.63 | Steady-state no-growth anchor; captures current earnings without terminal extrapolation; highly relevant for cyclical businesses |
| Comparable Transactions / Peers | $133.86 | Relative valuation; reflects sector multiples that are themselves cycle-elevated |
| BRS Composite Median | $114.75 | Central fundamental anchor for Bihzuun’s normalized intrinsic value framework |
| DCF (Peak-Cycle Assumptions) | $1,006.95 | 89% divergence from composite median; only defensible under aggressive multi-decade extrapolation of peak margins — structurally fragile for commodity memory |
| Current Market Price | $900.20 | Effectively pricing in the DCF scenario in its entirety |
Valuation Framework Interpretation
The 89% divergence between the DCF output and the composite fundamental median is not a modelling error — it is the central diagnostic of this investment thesis. The market has chosen to price Micron on a perpetual peak-earnings trajectory, a scenario the DCF formalises but that the Graham Number and EPV explicitly reject. Our institutional view is that the Graham Number and EPV represent the more analytically conservative and appropriate anchors for a commodity memory manufacturer, precisely because their inputs are grounded in current verified earnings power rather than multi-decade margin assumptions.
The BRS Valuation Score of 0/100 is unambiguous. The persistence of a near-zero margin of safety across five consecutive screens (ranging 11.8%–11.9%, now in slight decline) indicates that the market price has been anchored far above intrinsic value for an extended period. Momentum screens continue to pass; value screens do not. This bifurcation is the defining characteristic of the current investment case.
Bihzuun’s fundamental target range of $100–$135 represents normalized 12–18 month fair value. The implied downside of approximately 85% from the current price reflects full-cycle mean reversion — not a base case event, but a risk that must be disclosed and understood. The primary scenario under which the market price is sustained or extended is one in which peak-cycle AI infrastructure spending persists for an anomalously extended duration, delaying mean reversion indefinitely. That scenario is plausible; it is not the base case for a commodity memory manufacturer.
4. Competitive & Industry Analysis
Global Memory Market Share (Q1 2026)
| Segment | Samsung | SK Hynix | Micron | Others |
|---|---|---|---|---|
| DRAM | 38% | 29% | 22% | 11% |
| HBM (Revenue Share) | 21% | 58% (incumbent) | 21% | — |
| NAND Flash | 29% | 18% | 13% | 40% (Kioxia, WD, Others) |
Competitive Dynamics
- SK Hynix HBM incumbency risk: SK Hynix holds 58% of HBM revenue and remains Nvidia’s primary GB200 platform HBM supplier. Architectural incumbency at the dominant AI accelerator platform is the most material competitive risk to Micron’s near-term HBM upside. Mid-cycle displacement is technically difficult. Micron’s path is through Vera Rubin (H2 2026) and beyond, where HBM4E ramp creates a re-entry point rather than a displacement of existing supply relationships.
- Micron’s HBM trajectory: HBM4 high-volume production commenced ahead of schedule; management targets 25% HBM market share in the medium term, representing a near-doubling from the current 21%. Each HBM wafer consumes approximately three times the capacity of standard DDR5, meaning every percentage point of HBM penetration tightens standard DRAM supply — a self-reinforcing pricing dynamic that benefits Micron’s entire product portfolio.
- Chinese memory risk (YMTC / CXMT): Subsidized Chinese NAND supply from YMTC represents the primary long-tail competitive threat to Micron’s NAND economics. Micron’s public support for the MATCH Act is a strategic posture as much as a policy preference — passage would constrain Chinese market access and protect the pricing cycle; failure would accelerate commoditization risk in NAND.
- Samsung’s dual-front pressure: Samsung leads in both DRAM (38%) and NAND (29%), creating competitive pressure across Micron’s entire product line. However, Samsung’s own HBM execution delays have inadvertently benefited both SK Hynix and Micron in the most margin-accretive segment.
- Structural demand shift: The HBM total addressable market is projected to exceed $100 billion in 2027. This is not a commodity memory expansion — it is a structurally new demand vector. Micron’s ability to participate proportionally in this TAM expansion is the primary upside scenario for the long-duration bull case.
5. Risk Mapping
| Risk Category | Specific Risk | Severity | Time Horizon | Mitigants |
|---|---|---|---|---|
| ⚠ IMMINENT | FOMC decision July 29 — hawkish surprise or hike signal | Critical | <24 hours | 4 consecutive holds reduces probability; but guidance language alone can re-price multiples |
| Macro | Q2 GDP (July 30) and July Payrolls (August 7) signal demand destruction | High | 1–2 weeks | AI capex appears insulated from near-term macro softness; June payrolls already weak at +57K without visible tech spending pullback |
| Valuation | Extreme premium to normalized fundamentals (−87.2% margin of safety) | Critical | Medium-term | Momentum, sold-out supply, and multi-year contracts sustain market price; no near-term fundamental catalyst for mean reversion unless earnings disappoint |
| Supply Cycle | Memory pricing reversal if supply catches up to AI demand faster than expected | High | 6–18 months | Structural HBM shortage; multi-year SCAs; capacity shift from commodity to HBM tightens standard memory supply simultaneously |
| Capex Cycle | ~$27B FY2026 capex seeds future supply overhang; fab construction at cycle peaks historically destroys capital | Moderate–High | 18–36 months | HBM-specific capacity; SCAs de-risk utilization; federal incentives partially offset cost basis |
| Geopolitical | MATCH Act failure; Chinese market access restrictions on Micron products | Moderate | Ongoing | Domestic manufacturing status; Micron actively lobbying for favourable legislation; HBM is not currently a China-demand product |
| Competitive | SK Hynix maintains Nvidia incumbency; Micron excluded from dominant AI platform HBM slot | Moderate | 6–12 months | HBM4E ramp into Vera Rubin platform (H2 2026); diversified HBM customer base beyond Nvidia |
| Market Regime | Sector rotation to financials/industrials in steepening yield curve regime historically compresses high-multiple tech on relative basis | Moderate | Ongoing | Absolute returns may remain positive; alpha drag is a relative positioning risk, not an absolute loss scenario |