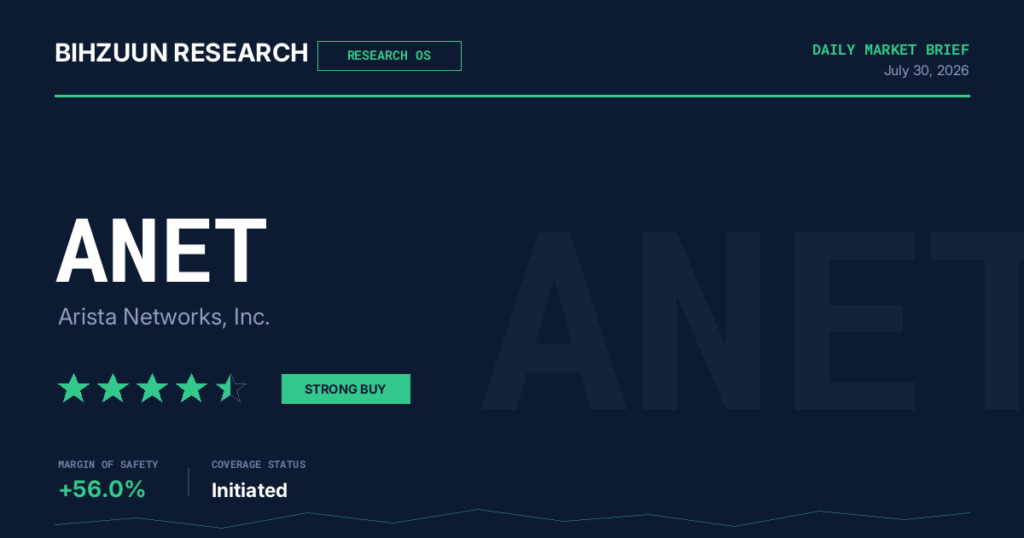
Bihzuun Research — Institutional Equity Report
Arista Networks, Inc. (NYSE: ANET) | Report Date: July 30, 2026
| Ticker | Exchange | Current Price | BRS Star Rating | 12-Month Target | Margin of Safety | Investment Horizon | BRR Posture |
|---|---|---|---|---|---|---|---|
| ANET | NYSE | $157.97 |
★ ★ ★ ★ ★ Strong Buy |
$185–$195 | Negative on static comparables; positive on DCF basis | 12–24 Months | Conditional Buy — Horizon-Dependent |
1. Business Overview & Economic Moat
Company Profile
Arista Networks is the preeminent independent pure-play in high-performance cloud and enterprise networking, generating $9.006 billion in trailing revenue with a 39% net margin — a financial profile more reminiscent of a software franchise than a hardware integrator. The company’s commercial architecture is anchored by Extensible Operating System (EOS), a single, unified network operating system spanning its entire switching and routing portfolio. EOS is simultaneously Arista’s primary competitive differentiator, its principal source of switching-cost asymmetry, and the engine through which the company monetizes a growing recurring software and services revenue stream. Arista’s customer base is concentrated at the apex of the demand hierarchy: global cloud hyperscalers (“cloud titans”) responsible for the world’s most demanding data center builds, alongside a growing enterprise campus segment.
Economic Moat Assessment
- Width: Wide. Arista holds the number-one market share position in high-speed switching above 10 Gb Ethernet, a category that is architecturally central to AI infrastructure deployment. This is not a legacy position being defended — it is a position being actively extended into AI fabric networking, where the company has raised its 2026 AI revenue target to $3.5 billion, effectively doubling AI-related sales annually.
- Source 1 — Software Lock-In: EOS’s open, programmable architecture creates deep developer-level integration within customer environments. Ripping and replacing a network operating system embedded across thousands of switches, monitored by CloudVision, and woven into automation workflows is a multi-year undertaking with material operational risk. This asymmetry — easy to adopt, prohibitively costly to abandon — is the bedrock of Arista’s pricing power.
- Source 2 — Hyperscaler Preferred-Vendor Status: Arista has achieved preferred-vendor designation with the world’s largest cloud operators, a status that manifests in forward purchase commitments (now $8.9 billion, up from $6.8 billion in Q4), multi-year capacity reservations, and co-engineering relationships that function as an effective barrier to new entrants and incumbent challengers alike.
- Source 3 — Capital Efficiency as Moat Signal: An elite 35% ROIC generated without long-term debt is the quantitative fingerprint of genuine competitive advantage. Competitors cannot replicate Arista’s returns by spending more; they must replicate its software integration depth and customer relationships, neither of which are purchasable at any near-term price.
- Durability Caveat: Moat durability is currently contingent on supply chain resolution. A company unable to ship product cannot exercise pricing power or deepen customer relationships at the pace the AI infrastructure cycle demands. This supply dependency is the single most significant near-term constraint on moat translation into financial results, and it is addressed in full in the Risk section.
2. Financial Deep Dive
Income Statement Quality
| Metric | Value | Bihzuun Assessment |
|---|---|---|
| Revenue (TTM) | $9.006B | Scale achieved; growth compounding |
| Net Income (TTM) | $3.511B | Exceptional absolute profitability |
| Net Margin | ~39% | Software-grade margins in a hardware-adjacent business; best-in-class |
| Revenue Growth Rate | 23.1% (trailing); 27.7% (2026 guided) | Acceleration into AI cycle; above initial guidance |
| Gross Margin Band | 62%–64% | Maintained under supply pressure; resilient pricing power |
| 4-Quarter Avg. EPS Surprise | +8.3% | Consistent execution track record |
Balance Sheet & Capital Allocation
| Metric | Value | Bihzuun Assessment |
|---|---|---|
| Total Equity | $12.37B | Substantial and growing |
| Long-Term Debt | $0 | Zero leverage; fortress balance sheet |
| Debt-to-Equity Ratio | 0.0% | ROE generated purely by operational excellence |
| Return on Equity | 28.4% | High-quality; zero leverage effect |
| ROIC | ~35% | Elite; confirms genuine competitive advantage |
| Purchase Commitments | $8.9B (up from $6.8B) | Demand visibility is extraordinary; supply risk is the binding constraint |
| Deferred Product Revenue | $3.63B (Q1 2026) | All-time high; conversion to recognized revenue is a near-term catalyst |
| Dividends | None | Capital retained for reinvestment into high-ROIC opportunities |
Arista’s balance sheet is structurally exceptional. The combination of 28.4% ROE, zero long-term debt, and 35% ROIC is vanishingly rare in enterprise technology at this revenue scale. The $8.9 billion in purchase commitments — a figure that has grown meaningfully in a single quarter — validates the demand signal underpinning the bull case and simultaneously illuminates the supply chain risk: Arista is committing capital at scale precisely because it cannot obtain components on normal commercial timelines. The $3.63 billion deferred product revenue balance represents a visible earnings backlog; the pace of its conversion will be among the most scrutinized data points in the August 4 earnings release.
3. Multi-Model Valuation Assessment
Model Output Summary
| Valuation Model | Output / Fair Value | Applicability to ANET | Weight in Composite |
|---|---|---|---|
| Discounted Cash Flow (Declining Growth) | $240.55 (range: $228.28–$253.30) | High — structurally appropriate for capital-light, high-growth compounder | Primary |
| Comparable Company Model | $83.70 | Medium — peer set selection materially drives output; may systematically undervalue ANET | Secondary |
| Graham Number | $24.84 | Negligible — designed for asset-heavy, dividend-paying industrials; structurally inapplicable | Excluded from composite |
| Composite Median (model-driven) | $83.70 | Distorted by Graham Number’s structural inapplicability | Reference only |
| Bihzuun 12-Month Target (Blended) | $185–$195 | DCF-weighted, comparable-adjusted, regime-discounted | — |
Valuation Interpretation
- Model Divergence is a Signal, Not a Flaw: The 65% divergence between the DCF output ($240.55) and the comparable model ($83.70) is not an anomaly to be averaged away — it is a direct expression of the valuation tension inherent in pricing a high-growth, capital-light compounder against peers with different margin and growth profiles. Investors who anchor exclusively to the comparable output will systematically undervalue businesses with ANET’s ROIC and growth durability; those who anchor exclusively to the DCF will carry excessive sensitivity to terminal rate assumptions.
- Graham Number Exclusion: The Graham Number of $24.84 is excluded from the composite with full analytical justification. That framework was architected for asset-intensive, dividend-paying businesses in a pre-software-economics era. Applying it to a company generating 39% net margins with zero debt produces an output that is arithmetically derivable but economically meaningless for investment decision-making.
- DCF Sensitivity: The DCF’s $240.55 central estimate carries material sensitivity to discount rate and terminal growth assumptions. A 100-basis-point increase in the discount rate or a 50-basis-point reduction in the terminal growth rate would compress the output meaningfully. Investors should not treat the DCF range as a floor.
- Current Price Context: At $157.97, ANET trades at a price-to-sales multiple of 21.9x — a 10-year peak — against our blended 12-month target of $185–$195. This implies approximately 17%–23% upside contingent on continued execution. The market is pricing near-flawless delivery; the margin of safety is structurally thin, and the investment case rests on growth quality rather than valuation discount.
- Valuation Score Context: The formal valuation scorecard registers 0 out of 100, and the income scorecard 15 out of 100, confirming that the market premium for quality and growth is absolute. ANET is not a value investment — it is a quality-growth investment at a price that tolerates no negative revision.
4. Competitive & Industry Analysis
Market Share Landscape (Datacenter Ethernet, Q2 2025 IDC Data)
| Vendor | Total Ethernet Market Share | Datacenter Share (Q2 2025) | YoY Change | Trajectory |
|---|---|---|---|---|
| Cisco | 27.3% | Significant incumbent | Stable-to-declining in pure switching | AI counter-offensive underway; $2B+ AI orders FY2025 |
| Arista Networks | 18.9% | 18.9% (down from 21.3% in Q1 2025) | Moderate sequential share loss | #1 in >10 Gb Ethernet; AI fabric positioning via Ultra Ethernet |
| NVIDIA (Spectrum-X) | Rapidly expanding | 25.9% (Q2 2025) | +647% YoY | Most disruptive near-term competitive entrant |
| HPE / Juniper (Combined) | Meaningful enterprise presence | Post-merger integration ongoing | Portfolio consolidation | AI-native enterprise networking focus; campus competition intensifying |
Competitor Analysis
- Cisco Systems — Primary Incumbent Challenger: Cisco’s AI infrastructure ambition is credible and increasingly well-funded: $2 billion+ in webscale AI orders in FY2025, more than double its original $1 billion target, underscores that Cisco is not ceding the AI networking market passively. The imminent availability of Silicon One G300-based systems at 102.4 Tbps in late 2026 directly targets Arista’s performance positioning. However, Cisco’s broader portfolio complexity — spanning security, collaboration, and observability — creates internal resource allocation trade-offs that Arista, as a pure-play networking specialist, does not face. Arista’s EOS software depth and hyperscaler relationships represent a structural advantage that Cisco’s broader platform cannot easily replicate.
- NVIDIA (Spectrum-X) — Most Disruptive Near-Term Threat: NVIDIA’s ascent from 21.1% to 25.9% datacenter Ethernet share in a single quarter is the single most structurally significant competitive development in the current period. This is not incremental market share erosion — it is a step-change driven by Spectrum-X’s optimisation for NVIDIA GPU fabrics, the very workloads at the center of the AI infrastructure investment supercycle. The competitive dynamic is nuanced: Arista retains higher share in non-NVIDIA GPU environments and is a co-participant in the Ultra Ethernet Consortium, meaning the relationship contains elements of both competition and ecosystem collaboration. Nevertheless, the speed of NVIDIA’s share gain demands ongoing monitoring at the thesis level, not merely the risk register.
- HPE / Juniper — Enterprise Segment Pressure: The completed HPE-Juniper combination creates a unified portfolio targeting AI-native networking, campus, and enterprise segments. This intensifies competition in precisely the enterprise campus markets that Arista has identified as a growth vector beyond its hyperscaler core. The combined entity’s go-to-market scale is a meaningful headwind for Arista’s campus expansion ambitions.
Industry Structural Tailwinds
- Global AI infrastructure capital expenditure cycle is driving unprecedented demand for high-speed networking, with hyperscalers committing multi-year capacity builds that create visible multi-year demand visibility for preferred vendors.
- The shift from InfiniBand to Ethernet-based AI fabrics — actively promoted by the Ultra Ethernet Consortium — is structurally favorable for Arista’s technology positioning and customer relationships.
- Enterprise campus networking modernization represents a TAM expansion opportunity beyond the hyperscaler core, though competitive intensity is rising with HPE/Juniper and Cisco both actively targeting this segment.
5. Risk Mapping
| Risk Factor | Severity | Duration | Thesis Impact | Monitoring Indicator |
|---|---|---|---|---|
| Supply Chain — Wafer & Silicon Scarcity | HIGH | Extended (52-week lead times standard) | Hard ceiling on revenue recognition; directly constrains growth that justifies the premium multiple | Aug 4 supply commentary; deferred revenue conversion rate; purchase commitment trajectory |
| Valuation / Multiple Compression | HIGH | Regime-dependent | P/S at 10-year peak; any growth deceleration or rate-driven de-rating compresses the long-duration valuation with outsized downside | Fed rate path; Jackson Hole (Aug 27–29); September FOMC dot plot; 10-year yield |
| NVIDIA Share Gain in AI Fabrics | MEDIUM-HIGH | Structural / Ongoing | 647% YoY share increase is a thesis-level signal; risk of further displacement in GPU-intensive workloads | Quarterly IDC datacenter Ethernet market share data; NVIDIA Spectrum-X order flow commentary |
| Customer & Geographic Concentration | MEDIUM | Structural | North America >75% of sales; hyperscaler capex pause by 1–2 customers materially impacts results | Hyperscaler capex guidance (Meta, Microsoft, Google, Amazon earnings); customer diversification disclosures |
| Vendor Concentration (Broadcom / TSMC) | MEDIUM-HIGH | Structural | Single-source silicon dependency; TSMC concentration introduces Taiwan geopolitical risk and cost escalation exposure | TSMC earnings and capacity allocation commentary; geopolitical cross-strait developments; Broadcom pricing |
| Gross Margin Compression | MEDIUM | Near-to-Medium Term | Premium component costs to assure supply continuity compress gross margin below the 62%–64% band; impacts earnings quality | Gross margin guidance on Aug 4; management commentary on component cost trajectory |
| Macro / Rate Regime | MEDIUM | Regime-dependent | Stagflationary undertow, Fed hold, and steepening yield curve structurally unfriendly to long-duration growth equities; weak GDP or payrolls data amplifies de-rating risk | BEA Q2 GDP (Jul 30); July NFP (Aug 7); July CPI (Aug 12); Jackson Hole (Aug 27–29) |
| Post-Earnings Guidance Risk | HIGH (near-term, binary) | Acute / Event-Driven | Q1 2026 precedent: beat on revenue and EPS, -13.6% next-day reaction on guidance disappointment. Headline print is insufficient; supply language and Q3 guide are what the market will price | August 4 earnings release; Q3 2026 revenue guidance vs. implicit $11.5B annual run-rate |
6. Catalyst Monitor
Near-Term Catalyst Timeline
| Date | Event | Relevance to ANET | Bull Case Signal | Bear Case Signal |
|---|---|---|---|---|
| July 30, 2026 (Today) | BEA Q2 2026 GDP Advance Estimate | Sets macro tone entering earnings week; weak GDP amplifies growth multiple compression risk | GDP resilience supports growth equity multiples | Contraction / stagnation reading intensifies stagflationary narrative; pressures ANET’s long-duration valuation |
| August 4, 2026 (3 Trading Days) | ⚠️ ANET Q2 2026 Earnings — IMMINENT | Single most consequential near-term binary for the investment thesis | Revenue beat + supply improvement commentary + Q3 guide above $2.83B consensus + deferred revenue conversion acceleration | Supply deterioration language + guidance below implicit $11.5B full-year target + gross margin pressure widening |
| August 7, 2026 | July Nonfarm Payrolls | Following weak June (+57K), a second consecutive weak print frames Fed dovishness — potential rate cut catalyst | Strong payrolls without inflationary wage growth; growth durable, Fed flexibility maintained | Weak payrolls confirming slowdown; stagflation narrative reinforced; multiple pressure |
| August 12, 2026 | July CPI Release | Determines whether Fed can act; directly embedded in ANET’s discount rate and long-duration valuation | Inflation moderation creates rate cut optionality; tailwind for long-duration growth equities | Sticky or rising inflation reinforces Fed hold; structural headwind for ANET’s premium multiple |
| August 27–29, 2026 | Jackson Hole Symposium (Chair Warsh) | Potential regime-defining macro event; a hawkish signal resets multiples across the growth complex | Dovish pivot or cut signal; meaningful multiple re-rating tailwind for ANET | Hawkish framing; higher-for-longer signal; significant de-rating risk for premium valuation |
| September 15–16, 2026 | FOMC Meeting & Full Dot Plot | Terminal macro event of the near-term window; dot plot update resets the cost-of-capital framework embedded in ANET’s DCF | Rate cut or credible forward guidance toward cuts; DCF tailwind | Upward revision to terminal rate; direct compression of ANET’s $240.55 DCF central estimate |
August 4 Earnings Framework — What the Market Will Actually Price
- Consensus Baseline: Revenue of $2.83 billion; EPS of $0.89. A beat on these figures is the base case (4-quarter average surprise of +8.3%), but is explicitly table stakes — not the re-rating event.
- The Real Test — Supply Trajectory: Q1 2026’s -13.6% post-earnings reaction occurred despite a headline beat, driven by supply commentary that failed to signal improvement. The August 4 decision tree for sophisticated investors begins with a single question: is supply getting better, stable, or worse?
- Deferred Revenue Conversion: The $3.63 billion deferred product revenue balance rose by $643 million in Q1. The degree to which Q2 converts this backlog into recognized revenue is the forward-looking indicator for bulls that supply constraints are beginning to clear.
- Full-Year Framing: Management’s updated guidance implies approximately $11.5 billion in 2026 revenue (27.7% growth). Morgan Stanley notes that analyst expectations range from 28%–30%, meaning guidance in-line with the $11.5 billion implicit target may again disappoint the Street’s upper-end expectations.
7. Investment Verdict
Synthesis
Arista Networks presents the institutional investor with a genuinely rare combination: a wide and durable economic moat, elite financial quality, a verified structural position in the AI infrastructure investment supercycle, and a management team with a multi-year track record of disciplined execution. The fundamental demand story is not speculative — it is visible in $8.9 billion of purchase commitments, a $3.63 billion deferred revenue balance, and a 2026 AI revenue target of $3.5 billion that reflects doubling growth in the most consequential technology spending cycle of the decade.
At the same time, intellectual honesty requires acknowledging the constraints that bound the near-term investment case. ANET trades at a price-to-sales multiple of 21.9x — a 10-year peak — in a macro regime characterized by elevated duration risk, a Fed on hold, and a market that has already demonstrated its willingness to punish management teams whose guidance fails to match buy-side expectations, regardless of headline beat quality. The supply chain is not a near-term catalyst; it is the binding constraint on the thesis. A business that cannot ship product cannot book the revenue that justifies the multiple. And NVIDIA’s 647% year-over-year share gain in datacenter Ethernet is a competitive development that warrants thesis-level monitoring rather than footnote treatment.
The cross-referencing of valuation, competitive analysis, and catalyst timing produces a clear investment conclusion: ANET is a 12-to-24-month conviction position for investors with the horizon and risk tolerance to absorb near-term volatility, particularly the August 4 binary. For tactical investors with shorter horizons, position sizing should be reduced ahead of the print, with any post-earnings weakness accompanied by improving supply language representing the highest-quality entry point the market is likely to offer in this cycle.
BRS Rating & BRR Posture
| Component | Assessment |
|---|---|
| Bihzuun Research Score (BRS) |
★ ★ ★ ★ ★ Strong Buy |
| Bihzuun Research Rating (BRR) | Conditional Buy — Full conviction on business quality and long-term AI infrastructure positioning; near-term tactical posture tempered by supply chain headwinds, peak valuation multiples, and August 4 earnings binary risk. Appropriate for 12–24 month horizons. Reduce sizing ahead of the August 4 print; treat confirmed supply improvement as a re-rating trigger. |
| 12-Month Price Target | $185–$195 (approximately 17%–23% upside from $157.97) |
| Key Re-Rating Trigger (Bull) | August 4 earnings with confirmed supply chain improvement + deferred revenue conversion acceleration + Q3 guide at or above $2.95B |
| Key De-Rating Risk (Bear) | Repeat of Q1 guidance disappointment dynamic; NVIDIA Spectrum-X share acceleration beyond Q2 2025 |